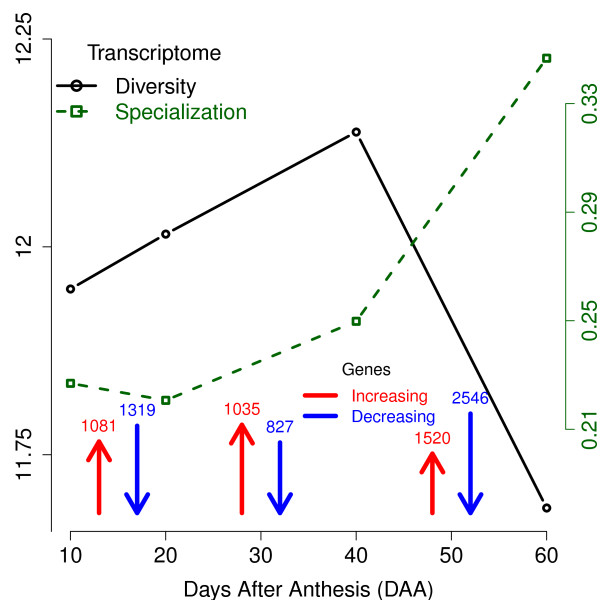
Figure 3.
Properties of the transcriptome and number of genes with significant change. Plots present the estimated diversity (in bits) and specialization (in relative arbitrary units) of the chili pepper transcriptome during development. Colored arrows present the number of genes with significant changes per interval (0.01 FDR), either increasing (red arrows) or decreasing (blue arrows). The length of the arrows is proportional to the percentage of changes in the interval.

