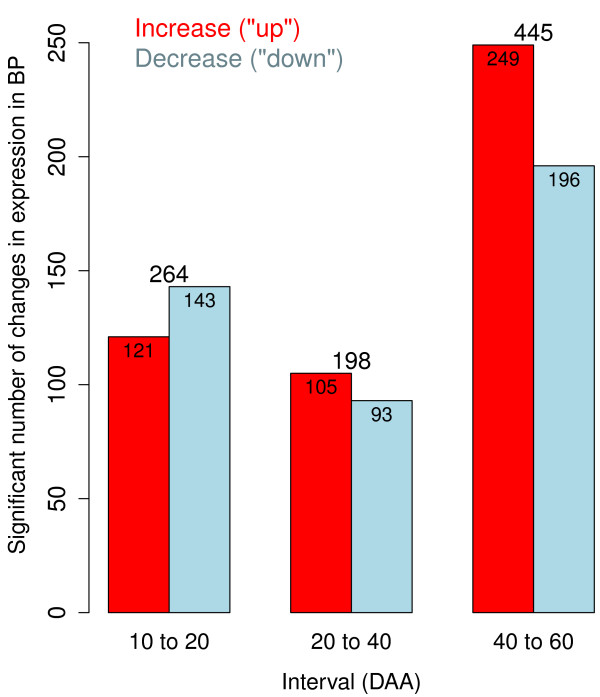
Figure 4.
Number of significant changes in expression of biological processes (BP) per interval. The number of significant changes in expression (0.01 FDR) for groups of genes representing biological processes (BP) is plotted for each interval, between 10 and 20, 20 to 40 and 40 to 60 DAA. Red bars present the number of BP that increased expression while blue bars present the number of BP that decreased expression in the corresponding interval.

