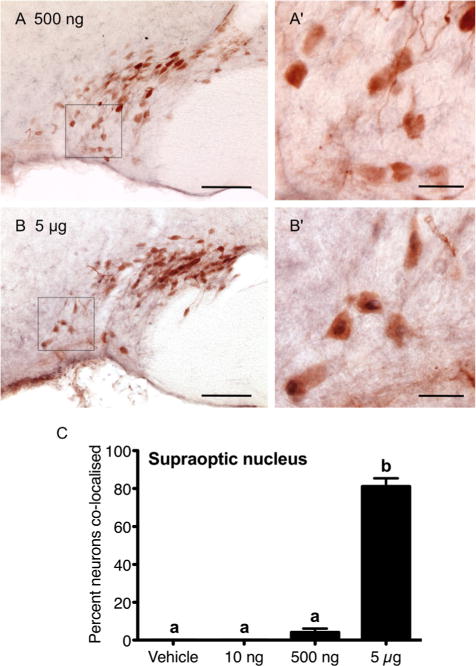
Figure 7.

Prolactin induction of nuclear pSTAT5 in oxytocin neurons in the supraoptic nucleus. Representative images of 500 ng (A,A′) and 5 μg (B,B′) icv prolactin-treated animals, showing the distribution of nuclear pSTAT5 (blue/black) and cytoplasmic oxytocin (brown) staining in supraoptic nucleus sections. The percentage of oxytocin-positive neurons displaying nuclear pSTAT5 in response to 10 ng (n = 7), 500 ng (n = 7), and 5 μg (n = 6) icv prolactin, or vehicle (n = 6) in the supraoptic nucleus is summarized in C. Bars with different letters are significantly different compared with vehicle (P < 0.05). Scale bars = 100 μm in A,B; 25 μm in A′,B′.
