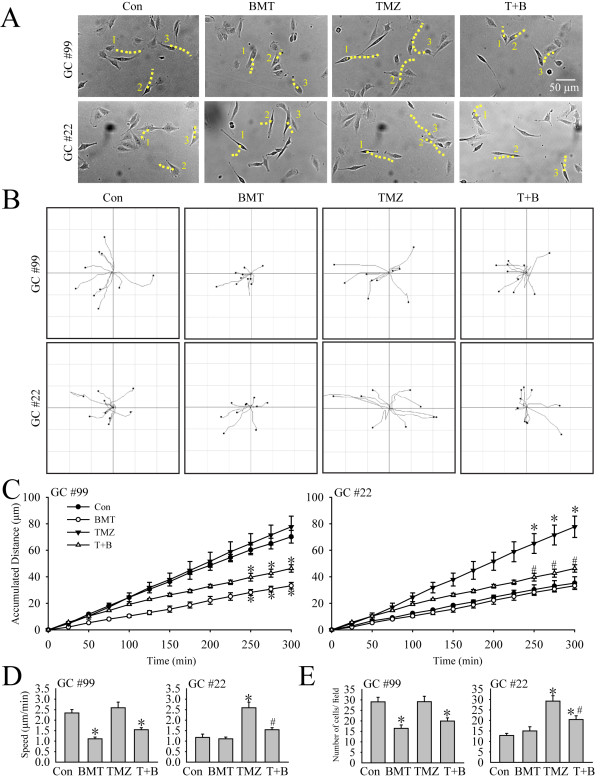
Figure 2.
Inhibition of NKCC1 activity abolishes glioma motility and serum-induced microchemotaxis in response to TMZ. A. Representative images of cell random movment in the presence of control medium (DMEM + 10 % FBS) (Con), 10 μM BMT (BMT), 100 μM TMZ (TMZ), or 100 μM TMZ plus 10 μM BMT (T + B) for 5 h. Three moving cells in the field were marked (#1-3). Yellow dashed line: changes of traces of cell gravity center with in 5 h. B. Motility of glioma cells was recorded using the Nikon TiE time-lapse imaging system. Random moving traces of 10 representative cells were shown under Con, BMT, TMZ, or T + B conditions in the 300-min recording period. C. Summary data of GC motility. Accumulated distance of GC cell movement during 0–300 min was calculated in each condition. Data were mean ± SEM (n =4). *p < 0.05 vs. Con. #p < 0.05 vs. TMZ. D. Summary data of average speed of GC movement in 5 h. Data were mean ± SEM (n =4). *p < 0.05 vs. Con. #p < 0.05 vs. TMZ. E. Serum-induced microchemotaxis of GC#99 and GC#22 was determined using the Boyden Chamber (8 μm pore) for 5 h under different treatment conditions (Con, BMT, TMZ, or TMZ plus BMT). Summary data of numbers of migrated cells per field in different treatment groups. Data are mean ± SEM. n = 6, *p < 0.05 vs. Con. #p < 0.05 vs. TMZ.

