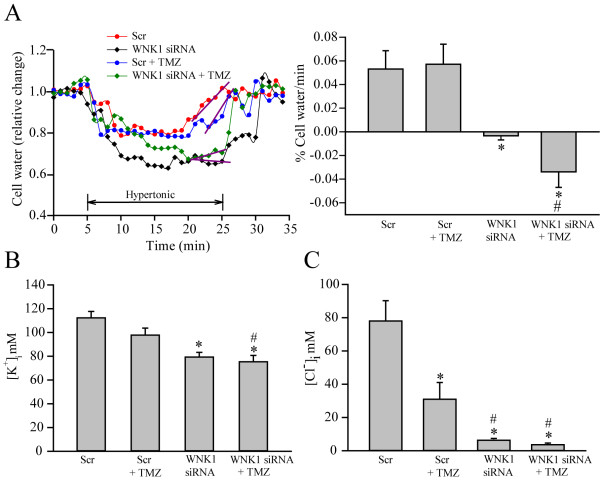
Figure 6.
Inhibition of WNK1 abolishes NKCC1-mediated regulatory volume increase and K+i and Cl-i homeostasis. A. Cell water content and relative cell volume were determined using the fluorescent dye calcein as described in Methods. GC#99 was treated with control medium, scramble siRNA (Scr) or WNK1 siRNA for 48 h. To induce RVI, cells were exposed to isotonic HEPES-MEM (310 mOsm, 5 min), hypertonic HEPES-MEM (370 mOsm, 25 min), and isotonic HEPES-MEM (5 min). The slope of the RVI was determined by fitting a regression line (in purple) to the cell volume recovery at ~ 20–25 min after exposure to hypertonic stress. Right panel, summary data of RVI. Data are means ± SEM. n = 3–4. B. Effects of WNK1 siRNA on [K+]i in GC#99. [K+]i was determined using the fluorescent probe PBFI. Data are means ± SEM, n = 3. *p <0.05 vs. Scr. C. Effects of WNK1 siRNA on [Cl-]i in GC#99. [Cl-]i was determined using the fluorescent probe MQAE. Data are means ± SEM, n = 4. *p < 0.05 vs. Con; #p < 0.05 vs. Scr + TMZ.

