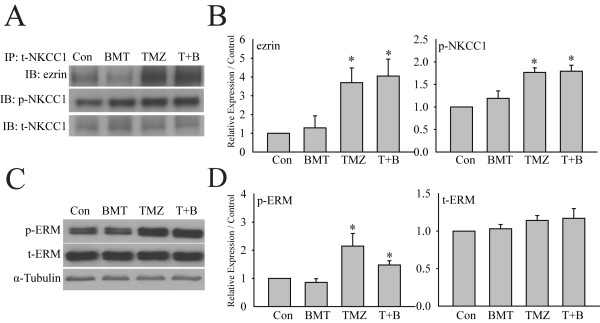
Figure 7.

Interactions between NKCC1 and p-ERM in GCs. A. Representative immunoblots showing immunoprecipitation of ezrin, p-NKCC1, or t-NKCC1 proteins in GCs. GC#22 cells were exposed to control medium (Con), 10 μM bumetanide (BMT), 100 μM TMZ, or 100 μM TMZ plus 10 μM BMT (T + B) for 4 h. B. Summary data of immunoblotting. Expression of each protein was first normalized by t-NKCC1. Relative expression level under different treatments was normalized to Con. Data are mean ± SEM. n = 4, *p < 0.05 vs. Con. C. Representative immunoblots showing expression of p-ERM and t-ERM proteins in GC#22. D. Summary data of immunoblotting. Expression of each protein was first normalized by α-tubulin. Relative expression level under different treatments was then normalized to Con. Data are mean ± SEM. n = 5, *p < 0.05 vs. Con.
