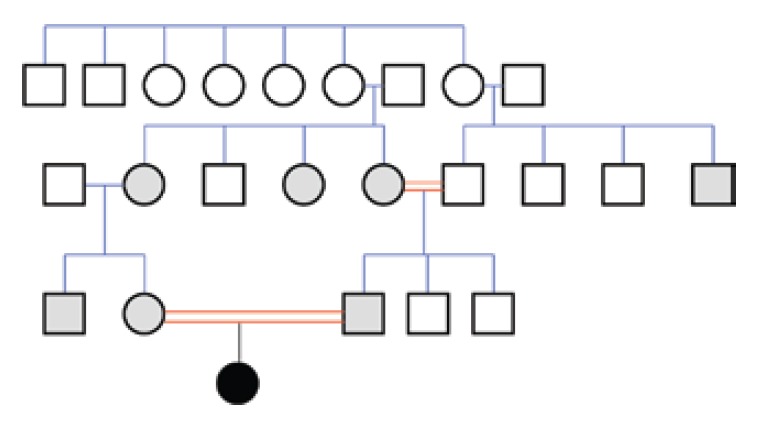
Figure 2.

Family pedigree.
The analbuminemic patient is represented by a black symbol. The albumin levels were determined in all the members of the second and third generation. Grey symbols indicate individuals who have albumin concentrations close to the lower limit of the normal range (about 30–35 g/L) and are therefore suspected to be heterozygous for the mutation. Heterozygosity was demonstrated for the parents of the proband.
