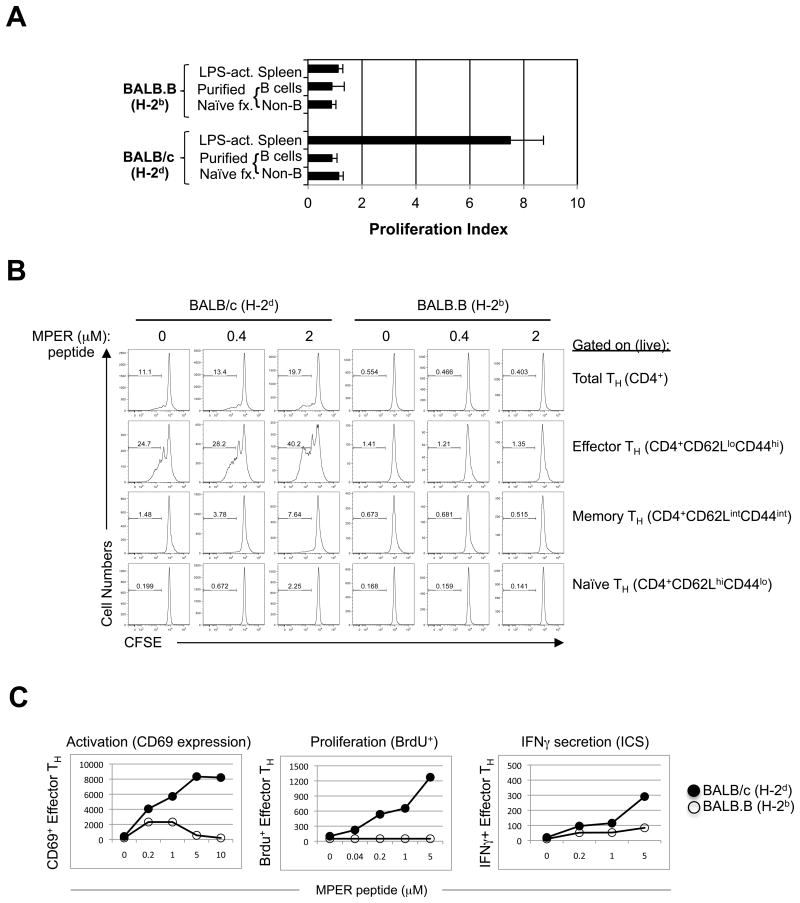
Figure 4. MPER-dependent CD4 TH activation, proliferation and IFNγ secretion in MHC H-2b and H-2d congenic strains.
A. MPER-induced proliferation of purified CD4 cells from immunized BALB/c and BALB.B mice (taken 10d after 5th immunizations with experimental regimen). In vitro re-stimulations were done using 5 μM of the MPER 656 peptide with the various denoted cell fractions used as APCs, and proliferation was measured by [3H] thymidine incorporation, as described in the Materials and Methods section. The CD4 T-cell proliferation index shown was calculated as the cpm ratio of peptide re-stimulated groups: control (unstimulated) groups. B. MPER-dependent proliferation of CD4 splenic subsets from immunized mice (10d after 5th immunizations with the experimental regimen) was measured by CFSE analysis. Numbers shown represent the percentage of dividing cells (i.e. denoted CFSE low). C. MPER-dependent TH effector activation (CD69 expression), proliferation (BrdU incorporation) and cytokine expression (IFNγ intracellular staining), were measured by flow cytometry. Numbers shown are MPER-induced TH effector CD4 cells/106 total CD4 cells.

