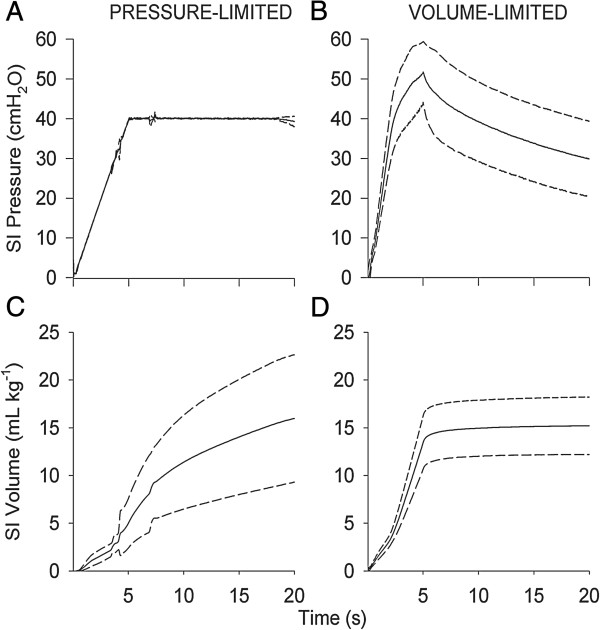
Figure 6.
Instantaneous changes in pressure and volume during the sustained inflation: Pressure (panels A and B) and volume (panels C and D) during pressure limited (left panel) and volume-limited (right panel) sustained inflations. Solid line represents mean, dashed line indicates SD of mean, varying with time.

