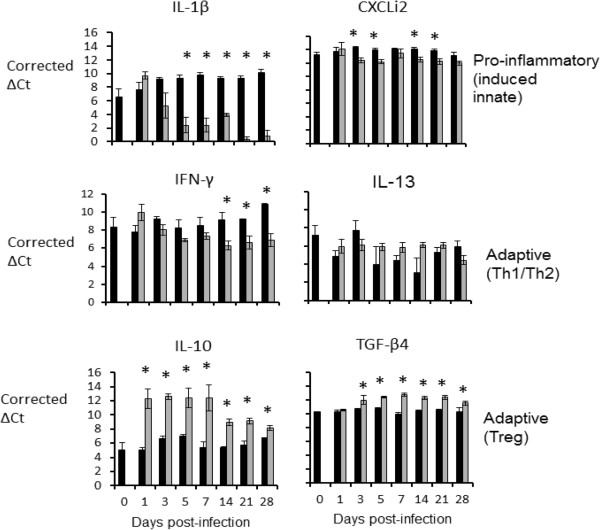
Figure 3.
Levels of cytokine mRNA transcripts in the liver as measured by real-time qRT-PCR (Taqman). Results expressed as corrected ΔCt values ± SE, in the livers of challenged (grey bars) and age-matched control (black bars) chickens. Five challenged and three control birds were sampled per time-point.* = P ≤ 0.05.

