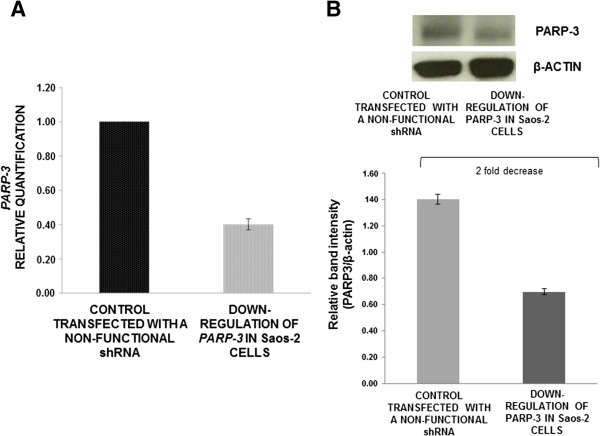
Figure 5.

PARP3 mRNA expression and protein levels in Saos-2 cells after transfection. (A) Analysis of PARP3 expression levels by qRT-PCR, after shRNA transfection (data are the average of triplicate experiments, media ± standard error). (B) Western-blot assay for testing PARP3 protein levels in Saos-2 cell line (bars are the average of three experiments, media ± standard error).
