Figure 6.
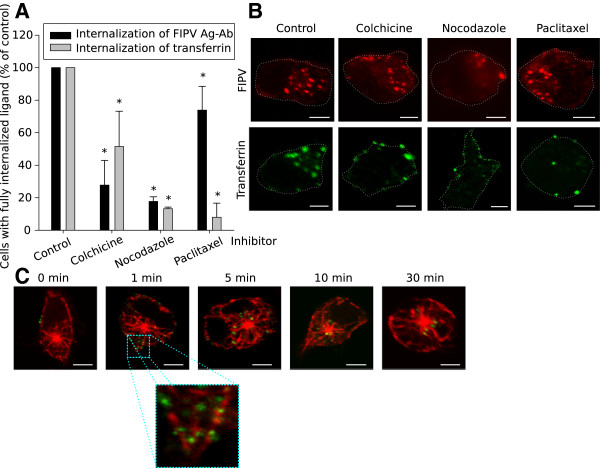
Role of microtubules during internalisation of surface expressed viral antigens in FIPV-infected monocytes. (A) Quantification of the internalisation in the presence of microtubule inhibitors. Results are given relatively to a control of untreated cells. Data are means and standard deviations of triplicate assays. The asterisk marks results that are significantly different from the untreated control (p < 0.05). (B) Confocal images of monocytes after internalisation in the presence of microtubule inhibitors. The activity of each inhibitor was tested with internalisation assays of transferrin. (C) Visualisation of the microtubules during antibody-induced internalisation of surface expressed viral antigens in FIPV-infected monocytes. All images show a single optical section through a monocyte and the scale bars represent 5 μm.

