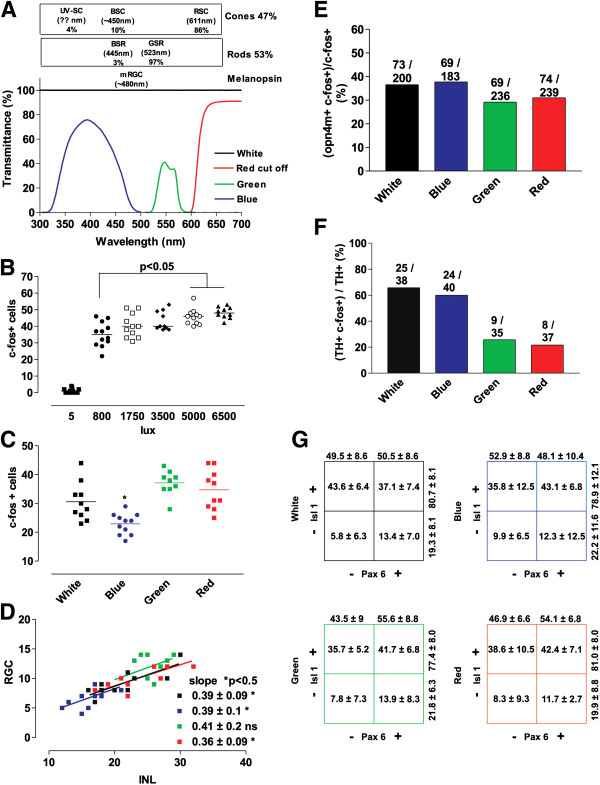
Figure 6.
Differential c-fos induction mediated by light colors. (A) Spectrum of transmittance for the blue, green, and red cut-off filters used to determine color dependence of c-fos activation. Also indicated are the different types of photoreceptors and their proportions in the retina of adult Xenopus laevis, as well as the maximum wavelength sensitivity for the corresponding opsins [37]. Ultraviolet (UV)-sensitive cones (UV-SCs), blue-sensitive cones (BSCs), and red-sensitive cones (RSCs) are present, as well as blue-sensitve rods (BSRs) and green-sensitive rods (GSRs). (B, C) Quantification of the number of c-fos + cells in a central retina section of a Stage 42 tadpole exposed to the indicated light intensities (B) or colors (C) for 30 minutes. The horizontal lines indicate the means. Statistics: One-way ANOVA plus Bonferroni’s multiple comparison tests.* P < 0.05. (D) Correlation between the numbers of c-fos-expressing cells in the inner nuclear layer (INL) and retinal ganglion cell (RGC) layer after colored light exposure. Data for each central retina quantified are represented by a dot (n ≥ 10). The slope of the linear regression and the statistical analysis of the coefficient of regression are indicated. (E) Percentage of activated mRGC (opn4m + c-fos+) with respect to the total number of c-fos + responsive cells in the RGC layer counted in successive sections throughout the whole eye as determined by double in situ hybridization. The average number of c-fos + mRGCs/eye is indicated (n = 2). (F) Percentage of TH + cells exhibiting c-fos expression after induction with different light colors for 30 minutes. The number of cells counted is indicated. (G) The number of c-fos + cells expressing Pax6 and/or Isl1 in the RGC layer in the central retina (expressed as percentages; mean ± SD; n = 10) after exposure to different light colors are represented in tabular form.

