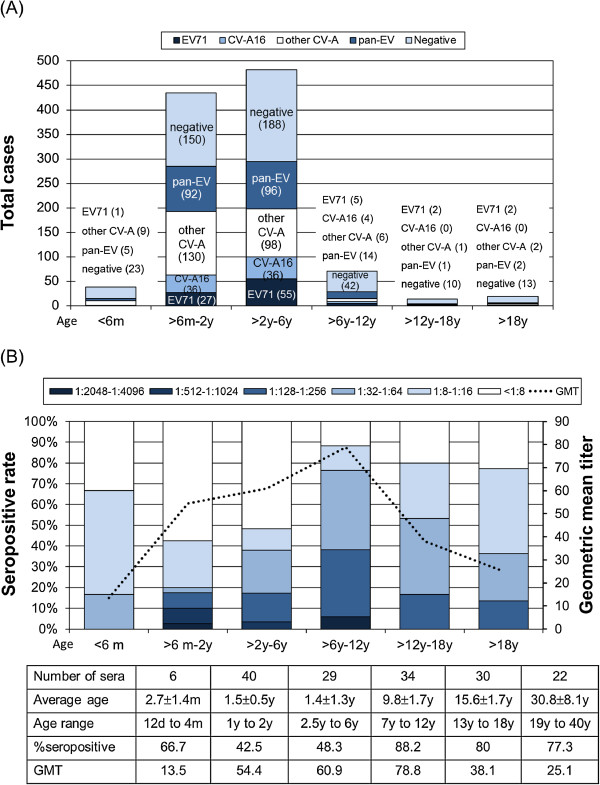
Figure 5.
Distribution of types of enterovirus and serum NAb against EV71 subgenotype B5 in the study population. (A) Age distribution of enterovirus infected patients with HFMD and HA during the study period and. Bar colors correspond to the numbers of patients with different types of enterovirus identified during the study period are indicated in the graph. (B) Serum titer of NAb against EV71 subgenotype B5 relative to age. The seropositive rates of individuals with NAb titers of 2-fold dilution are plotted on the y-axis. The dash line denotes the cumulative geometric mean titer according to donors’ age. The number of sera (161 total) from each of the six age groups are indicated in the table below the graph.

