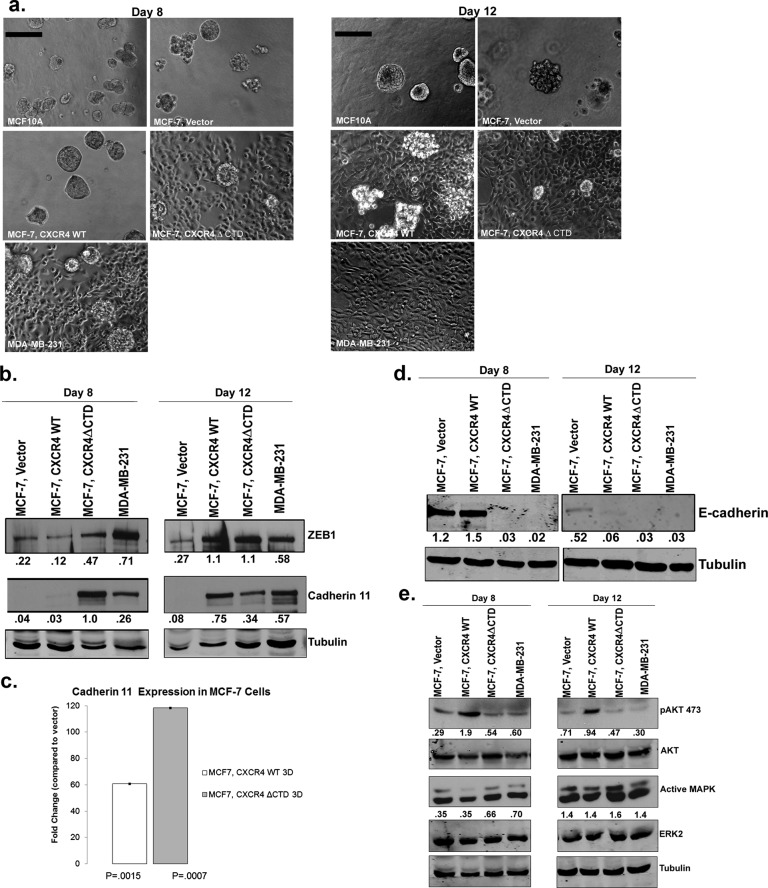
FIGURE 2:
MCF-7 CXCR4ΔCTD cells exhibit a stellate phenotype and MCF-7 CXCR4WT cells form predominantly stellate structures after day 8 in 3D rBM culture. (a) Colony formation in 3D rBM culture. MCF-10A, MDA-MB-231, and MCF-7 cell lines were incubated for 8 or 12 d in 3D rBM overlay cultures. Phase contrast images. Bars, 150 μm. (b) Western blot of ZEB-1, cadherin 11, and tubulin from cells grown in 3D rBM cultures at days 8 and 12. Densitometric scans from duplicate assays were quantitated and normalized to the loading control (tubulin). (c) qRT-PCR of cadherin 11 in cells from 2D or 3D rBM cultures at day 12. qRT-PCR analysis of mRNA for cadherin 11 in MCF-7 vector control, MCF-7 CXCR4WT, and MCF-7 CXCR4ΔCTD cells from 3D rBM cultures. Data are shown as the fold change in expression of MCF-7 CXCR4WT and MCF-7 CXCR4ΔCTD cells compared with vector control cells, with each gene normalized to β-actin. The difference in expression of cadherin 11 between MCF-7 CXCR4WT and MCF-7 CXCR4ΔCTD cells is statistically significant, based upon a 95% confidence interval. (d) Western blot of E-cadherin and tubulin from cells grown in 3D rBM cultures at days 8 and 12. Densitometric scans from duplicate assays were quantitated and normalized to the loading control (tubulin). (e) Western blot of pAKT473, total AKT, active MAPK, ERK2, and tubulin from cells grown in 3D rBM cultures at days 8 and 12. Densitometric scans from duplicate assays were quantitated, and pAKT473 was normalized to AKT, whereas active MAPK was normalized to ERK2.

