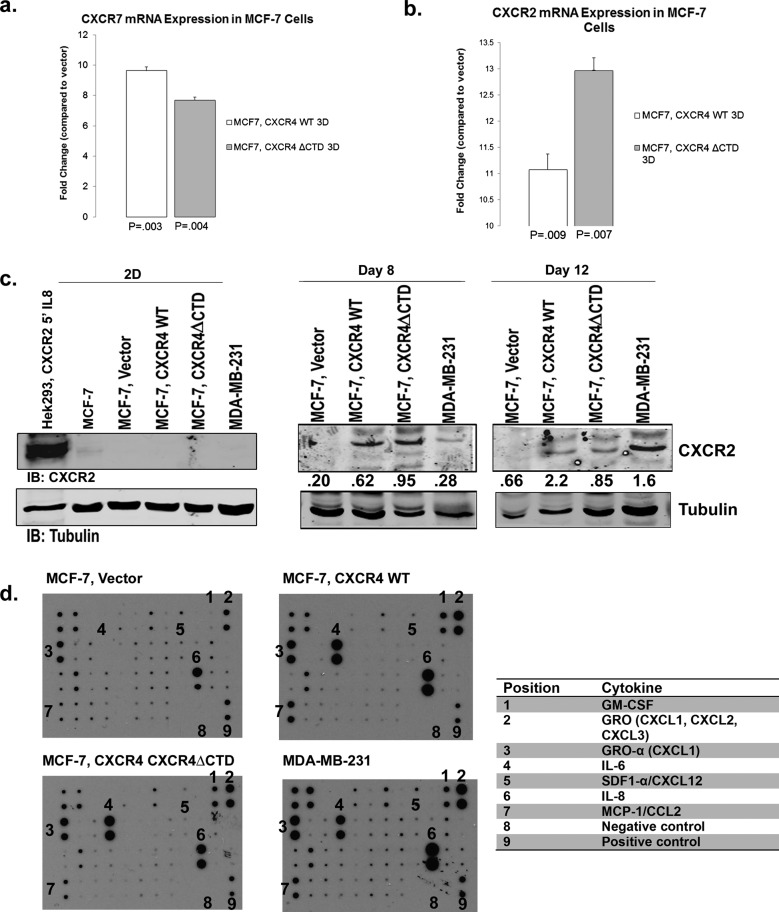
FIGURE 4:
CXCR7 and CXCR2 are up-regulated in MCF-7 cells expressing CXCR4WT or CXCR4∆CTD in 3D rBM cultures. qRT-PCR of CXCR7 (a) and CXCR2 (b) from cells grown in 2D or 3D rBM cultures at day 12. qRT-PCR analysis of mRNA for CXCR7 or CXCR2 in MCF-7 vector control, MCF-7 CXCR4WT, and MCF-7 CXCR4ΔCTD cells grown in 2D cultures compared with 3D rBM cultures at day 12. Data are shown as the fold change in expression of MCF-7 CXCR4WT cells and MCF-7 CXCR4ΔCTD cells compared with vector control cells for each gene normalized to the endogenous control β-actin. The difference in expression of CXCR7 and CXCR2 between MCF-7 CXCR4WT and MCF-7 CXCR4ΔCTD cells is statistically significant, based upon a 95% confidence interval. (c) Western blot of CXCR2 and tubulin in cells grown in 2D cultures compared with 3D rBM cultures at days 8 and 12. Cells in 2D culture were stimulated with interleukin-8 (IL8; 100 ng/ml) for 5 min. Densitometric scans from triplicate assays in 2D culture were quantitated and normalized to the loading control (tubulin). Cells in 3D rBM culture were not stimulated with IL8. Densitometric scans from duplicate assays in 3D rBM culture were quantitated and normalized to the loading control (tubulin). (d) Cytokine array analysis of factors identified in conditioned media from 3D rBM cultures at day 8. Antibodies are immobilized on the array in duplicate, and the table lists antibody locations, including positive and negative controls.

