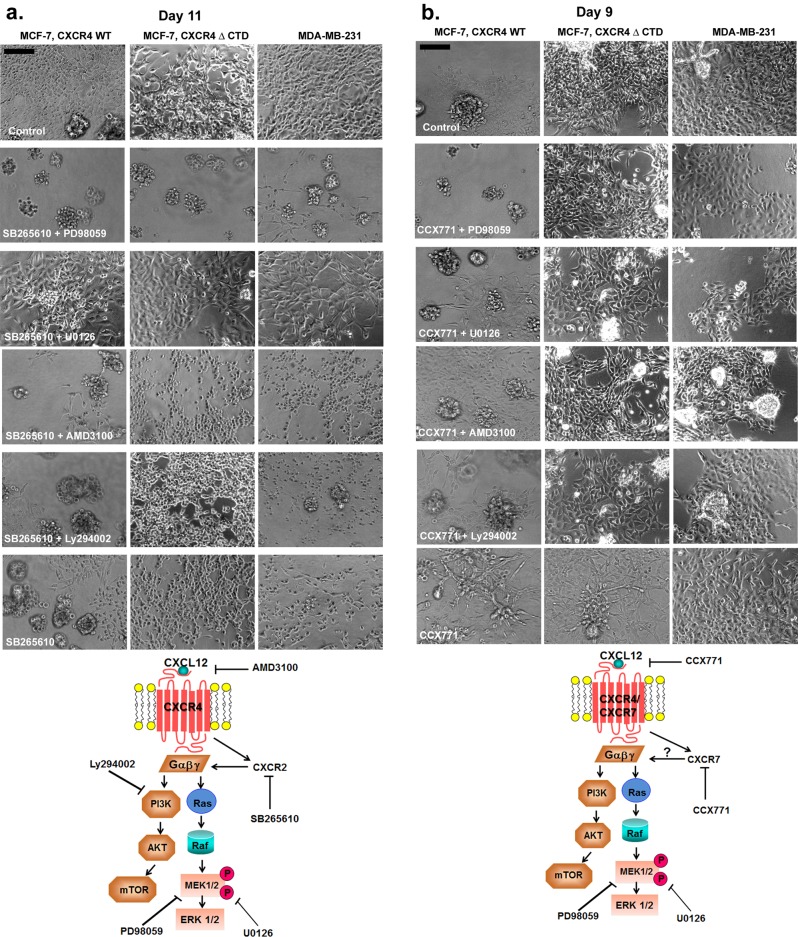
FIGURE 5:
Effects of CXCR2 or CXCR7 inhibition with the combined inhibition of CXCR4, PI3K, or MAPK on the growth of MCF-7 and MDA-MB-231 cells in 3D rBM cultures. (a) MCF-7 CXCR4WT, MCF-7 CXCR4ΔCTD, and MDA-MB-231 cells were incubated for 11 d in 3D rBM cultures in the presence of control (DMSO), CXCR2 inhibitor SB265610 (1 μM) and MEK1 inhibitor PD98059 (10 μM), SB265610 (1 μM) and MEK1/2 inhibitor U0126 (10 μM), SB265610 (1 μM) and CXCR4 inhibitor AMD3100 (20 μM), SB265610 (1 μM) and PI3K inhibitor Ly294002 (2 μM), or SB265610 (1 μM) alone. Cell lines were treated with inhibitors on day 2, and inhibitors were then added to the medium on alternate days. Phase contrast images. Bars, 150 μm. (b) MCF-7 CXCR4WT, MCF-7 CXCR4ΔCTD, and MDA-MB-231 cells were incubated for 9 d in 3D rBM cultures in the presence of control (DMSO), CXCR7 inhibitor CCX771 (1 μM) and PD98059 (10 μM), CCX771 (1 μM) and U0126 (10 μM), CCX771 (1 μM) and AMD3100 (20 μM), or CCX771 (1 μM) and Ly294002 (2 μM). Cell lines were treated with inhibitors on day 2, and inhibitors were then added to the medium on alternate days. Phase contrast images. Bars, 150 μm. Schematic overviews of the pathways inhibited are shown below a and b.

