
FIGURE 3:
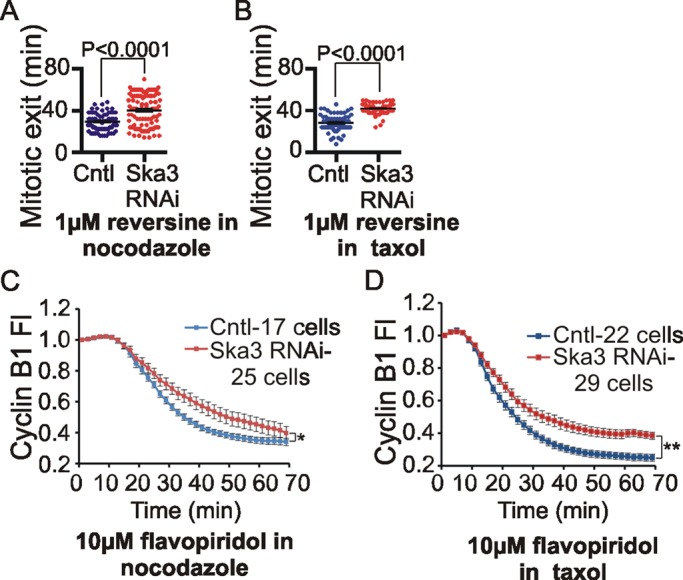
Ska3 depletion delays mitotic exit in cells treated with microtubule drugs. (A) HeLa H2B-GFP cells were transfected with control or Ska3 siRNA at 25 nM for 24 h. After washing off mitotic cells, cultures were treated with 3.3 μM nocodazole for 4 h. Reversine, 1 μM, was added, and time taken to exit mitosis in every cell was determined by imaging. Ska3-depleted cultures were delayed in mitotic exit (40 ± 1.5 min) compared with control cultures (29 ± 0.9 min). (B) Control and Ska3-depleted cells were treated as described but then released from nocodazole arrest into fresh medium for 30 min to allow spindles to form. Cells were then treated with 2 μM Taxol. Reversine, 1 μM, was added, and time taken to exit mitosis in every cell was determined by imaging. Ska3-depleted cells (42 ± 0.5 min) delayed mitotic exit compared with control cells (28 ± 0.9 min). Each dot represents one cell; the long horizontal line depicts mean, and whiskers denote SEM. (C) HeLa H2B-GFP cells were transfected with cyclin B1-mCherry and then transfected with control or Ska3 siRNA at 50 nM. Approximately 27 h posttransfection, cells were treated with 3.3 μM nocodazole. Flavopiridol, 10 μM, was added, and cyclin B1 degradation was recorded by measuring the decay of mCherry fluorescence. Ska3-depleted cells showed slower cyclin B1 degradation (p < 0.05). (D) Control and Ska3-depleted cells were treated as described but were then released from nocodazole arrest into fresh medium for 30 min to allow spindles to form. Cells were then treated with 2 μM Taxol. Then 10 μM flavopiridol was added and cyclin B1-mCherry degradation was measured. Overall, Taxol-arrested cells showed more rapid cyclin B1 degradation compared with nocodazole-arrested cells. Ska3-depleted cells showed slower cyclin B1 degradation (p < 0.005). Error bars indicate SEM, and cells were quantified from at least three independent experiments. The time taken to degrade 50% of cyclin B1 was calculated for every cell and used to determine statistical significance between control and Ska3-depleted cells. See also Supplemental Figures S2 and S3 and Supplemental Movie S3.