FIGURE 1:
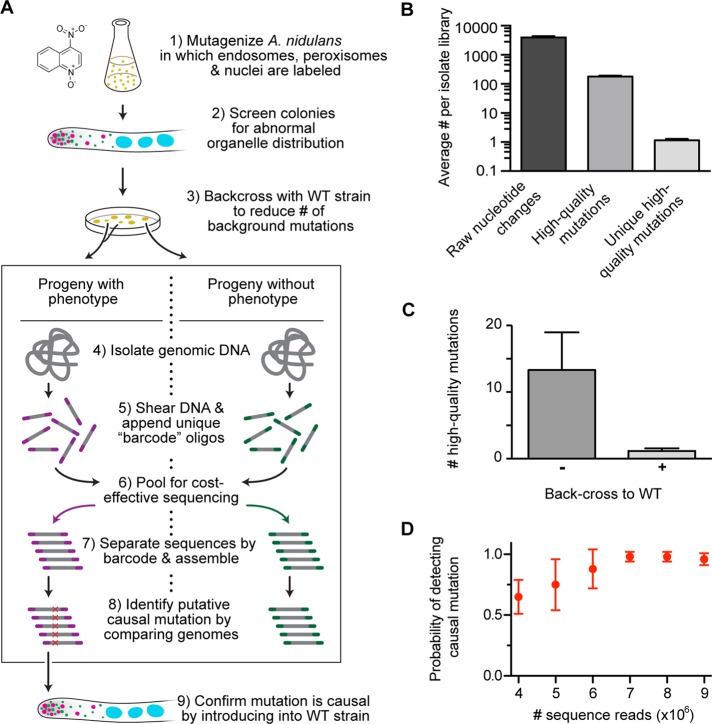
Multiplexed whole-genome sequencing to identify mutations in the A. nidulans transport machinery. (A) A flowchart of our experimental approach. 1) Spores from a strain harboring TagGFP-Rab5/RabA–labeled endosomes, mCherry-PTS1–labeled peroxisomes, and TagBFP-HH1–labeled nuclei were mutagenized with 4NQO at doses that generated either 10 or 50% survival rate. 2) These mutants were screened for abnormal distribution of endosomes, peroxisomes, or nuclei using fluorescence microscopy. 3) Each mutant was crossed to a wild-type nonmutagenized strain. The organelle distribution phenotype of progeny from each cross was examined, and progeny were sorted and pooled into two categories: progeny with phenotype and progeny without phenotype. 4) All progenies from each category were grown as a pool, and genomic DNA was then isolated from each pool. 5) This DNA was sheared, and 8–base pair unique barcodes were appended to the sheared ends. 6) Libraries containing distinct barcodes were pooled and sequenced using Illumina sequencing. 7) The sequencing data were separated by barcode and assembled. 8) Candidate causal mutations were identified. 9) Causal mutations were confirmed by introducing the mutation into a wild-type nonmutagenized strain. (B) Bar graph showing average number of nucleotide changes per isolate library after data processing. Average (± SEM) number of nucleotide changes was 3948.29 ± 411.66 before data processing (raw nucleotide change);177.71 ± 12.91 for nucleotide changes that occurred at least five times in our mutant data sets, did not appear in the wild-type A. nidulans reference sequences (Galagan et al., 2005; Wortman et al., 2009), and were not synonymous mutations (high-quality mutations); and 1.14 ± 0.14 after subtracting all nucleotide changes also found in progenies lacking the phenotype (unique high-quality mutations). All mean values were statistically different from each other (p < 0.0001, unpaired t test; n = 7 mutants). (C) Bar graph showing average (± SEM) unique high-quality mutations with (+) or without (–) a backcross to a nonmutagenized strain. A backcross significantly reduced the number of unique high-quality mutations from 13.33 ± 5.65 to 1.17 ± 0.17 (mean ± SEM; p = 0.015, Kolmogorov–Smirnov test). (D) Graph showing the probability of detecting a causal mutation as a function of the number of sequence reads. Using a bootstrap methodology, we randomly sampled mutant data sets (n = 6 mutants) for 4, 5, 6, 7, 8, and 9 million reads (with each read containing ∼43 base pairs of useful sequence data). This resampling process was repeated 10 times for each mutant. Error bars show the SD of the probability of detection.

