FIGURE 4:
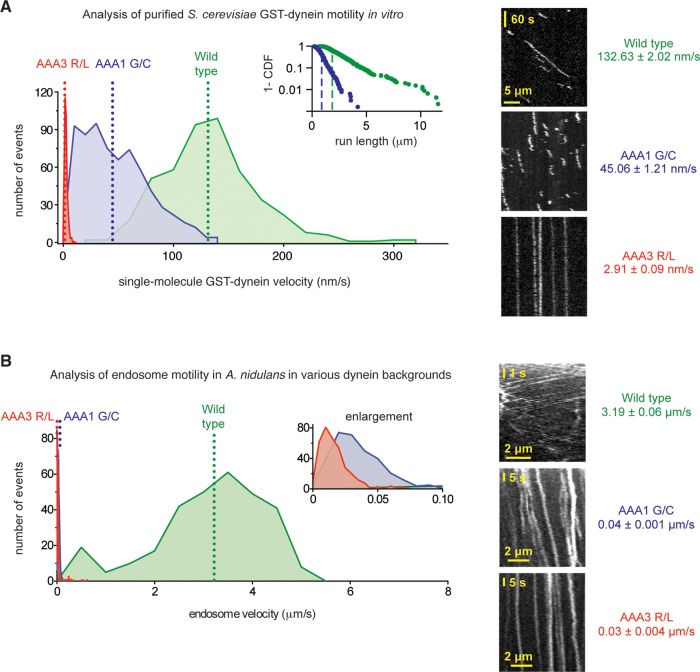
The dynein mutations severely reduce velocities in vitro and in vivo. (A) Left, velocity histograms for tetramethylrhodamine-labeled wild-type S. cerevisiae GST-Dyn1331 kDa (green) and the dyneinAAA1 G/C (blue) and dyneinAAA3 R/L (red) mutants. In S. cerevisiae dynein, the AAA1 G/C mutation corresponds to G1799C and the AAA3 R/L mutation corresponds to R2620L. The dotted lines indicate average velocities (132.63 ± 2.02 nm/s for wild-type dynein [mean ± SEM; n = 457], 47.96 ± 1.16 nm/s for dyneinAAA1 G/C [n = 679], and 2.91 ± 0.09 nm/s for dyneinAAA3 R/L [n = 374]). Both mutant dyneins are statistically slower than wild-type dynein (p < 0.0001; unpaired t test). Inset, log plot of the 1 – cumulative probability distribution of run lengths for the wild-type (green dots) and dyneinAAA1 G/C (blue dots) constructs. Average run lengths are 1.70 μm for wild type (green dashed line; error of the fit = 0.012 μm; n = 457) and 0.69 μm for dyneinAAA1 G/C (blue dashed line; error of the fit = 0.006 μm; n = 679). Run lengths for the dyneinAAA3 R/L construct could not be determined, as the majority of molecules remained attached to the microtubule for the entire duration of image acquisition. Right, representative kymographs. (B) Left, velocity histograms of retrograde endosome movement in A. nidulans hyphae in various dynein backgrounds: wild type (green), dyneinAAA1 G/C (blue), and dyneinAAA3 R/L (red). Inset, enlarged view of the x-axis. The dotted lines indicate average velocities (3.19 ± 0.06 μm/s in wild type [mean ± SEM; n = 296], 0.04 ± 0.001 μm/s in dyneinAAA1 G/C [n = 327], and 0.03 ± 0.004 μm/s dyneinAAA3 R/L [n = 368] hyphae). Endosomes in both mutant dyneins are statistically slower than in wild type (p < 0.0001; unpaired t test). Right, representative kymographs of endosomes in wild-type, dyneinAAA1 G/C, and dyneinAAA3 R/L hyphae.

