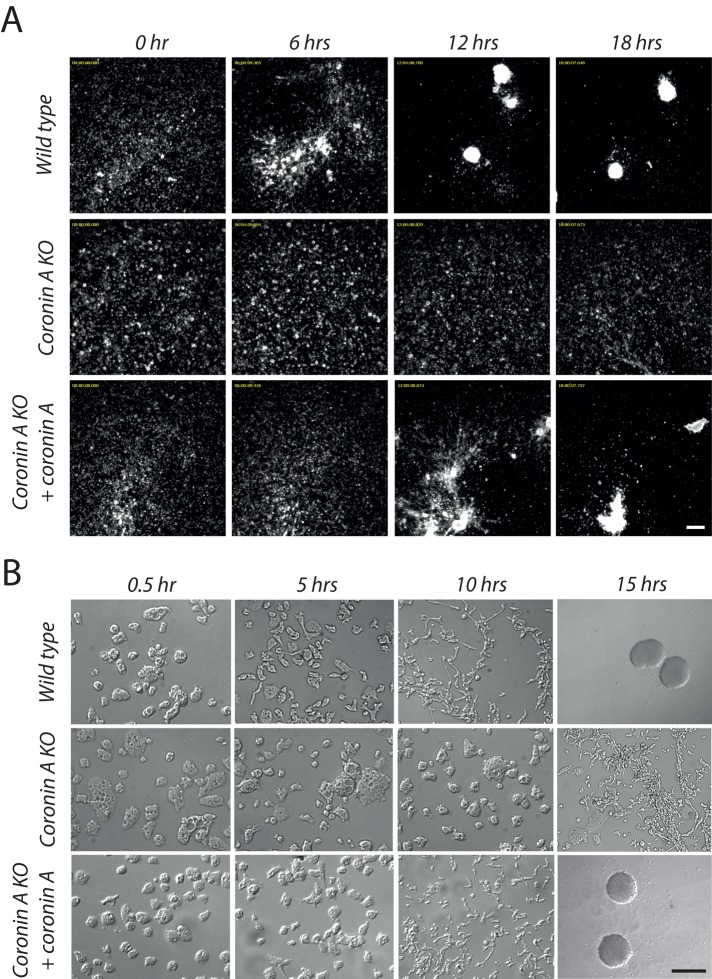
FIGURE 1:
Early development of wild-type and coronin A–deficient cells. (A) Dictyostelium cells were seeded into multiwell plates at a density of 2 × 10⁵ cells/cm2, starved in BSS, and imaged over a period of 20 h. The images shown are taken from a series of frames during the aggregation stage of the wild-type, coronin A–deficient, and complemented coronin A–deficient cells. Bar, 200 μm. See also Supplemental Movies S1–S3. (B) Growth phase cells were washed, resuspended in BSS, and inoculated in a plastic dish. Images are taken at the indicated time points. Bar, 50 μm, except for wild-type and coronin A–complemented, coronin A–deficient cells at 15 h, bar, 0.5 mm.

