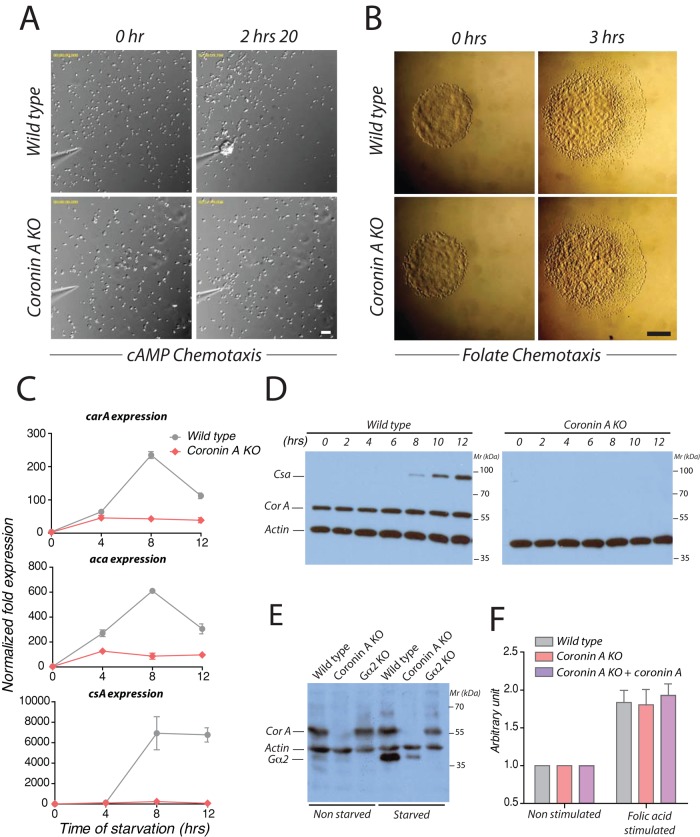
FIGURE 3:
Chemotaxis and developmentally regulated gene expression profiles of wild-type and coronin A–deficient cells. (A) Vegetative wild-type or coronin A–deficient cells were starved for 5 h, resuspended in BSS, and seeded at a density of 1 × 10⁵ cells/cm2. A cAMP gradient was established by injection of 1 μM cAMP through a micropipette at a pressure of 20 hPa. Cells were imaged every 20 s for 2.5 h. Bar, 50 μm. See also Supplemental Movies S4 and S5. (B) A 1-μl droplet of vegetative wild-type and coronin A–deficient cells was spotted on a 1.5% BSS agar Petri dish at a distance of 4 mm from a folate source (right part of the gel). Chemotaxis of the strains at 0 (left) and 3 h (right) after the drop deposition on agar. Bar, 1 mm. (C) The mRNA levels of acaA and carA, relative to the control Ig7 and gpdA at 0, 4, 8, and 12 h after the induction of starvation in BSS were determined by real-time PCR for wild-type and coronin A–deficient cells. (D) Starving cells in BSS in shaking cultures were collected at the indicated times after the initiation of starvation and boiled in SDS sample buffer. Lysates from an equal number of cells were separated on 10% SDS–PAGE, followed by immunoblotting for csA, coronin A, and actin expression. (E) Cells were grown in HL-5 or starved in BSS in shaking cultures and collected 5 h after the initiation of the starvation. Membranes were extracted as described in Materials and Methods and boiled in SDS sample buffer. Extracts from an equal number of cells were separated by 10% SDS–PAGE, followed by immunoblotting for Gα2, coronin A, and actin. (F) Vegetative wild-type, coronin A–deficient, and coronin A–deficient cells complemented with coronin A were washed and resuspended in BSS for 30 min. The cAMP production was determined as described in Figure 2C after a 6-min stimulation period with 50 μM folate. Results in C and F are presented as mean ± SD of triplicate determinations of a representative experiment of three independent experiments.

