FIGURE 4:
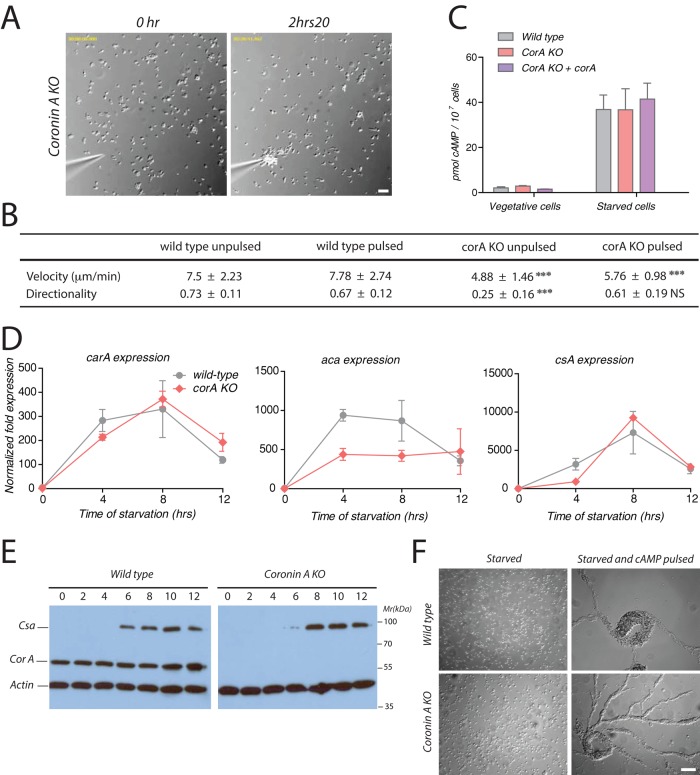
cAMP sensing, production, and early developmental gene expression upon exogenous cAMP pulses. (A) Coronin A–deficient cells were washed, starved, and pulsed during 5 h with 50 nM cAMP every 6.5 min. Cells were then washed, resuspended in BSS, and seeded at a density of 1 × 10⁵ cells/ml. A cAMP gradient was established as described in the legend to Figure 3A. Bar, 50 μm. See also Supplemental Movie S8. (B) Cells were prepared and processed as described in Figures 3A and 5A. Cell paths (from at least 30 cells per experimental condition from three independent experiments) were generated, and the velocity and directionality parameters were analyzed using the Chemotaxis and Migration Tool of ImageJ. Means ± SD; statistical significance between coronin A–deficient cells and corresponding wild-type cells are presented using a t test. ***p < 0 0.001; NS, not significant. (C) Cells were pulsed with cAMP as described in Materials and Methods and then assayed for cAMP production using the HTRF cAMP assay (Cisbio). (D) Vegetative wild-type and coronin A–deficient cells were washed, starved, and pulsed during 5 h with 50 nM cAMP every 6.5 min. Cells were then lysed at the indicated time points, and the mRNA levels of acaA, carA, and csA relative to the housekeeping control genes Ig7 and gpdA were determined at 0, 4, 8, and 12 h by real-time PCR. (E) Vegetative wild-type and coronin A–deficient cells were washed, starved, and pulsed with 50 nM cAMP every 6.5 min. Cells were collected at the indicated times after the initiation of the starvation and boiled in SDS sample buffer. Equal amounts of cells were separated by 10% SDS–PAGE and analyzed by Western blot for csA, coronin A, and actin expression. (F) Vegetative wild-type and coronin A–deficient cells were washed and starved with or without 50 nM cAMP pulsing during 5 h every 6.5 min in suspension. Cells were then washed, resuspended in BSS, and placed on a Petri dish at a density of 4 × 10⁵ cells/cm2. Images were taken 4 h after seeding of the cells. Bar, 50 μm. Results in C are presented as means ± SD of triplicate determinations of a representative experiment of three independent experiments.

