
FIGURE 7:
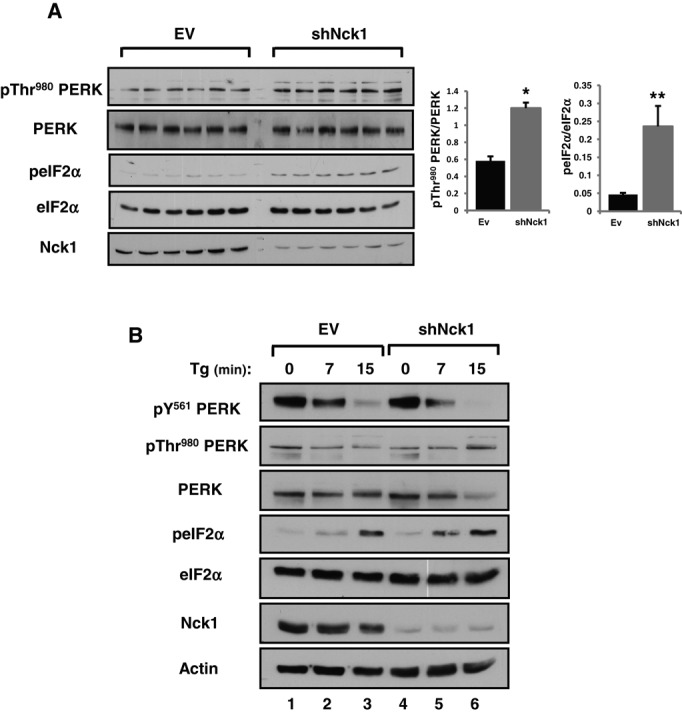
Nck1 modulates PERK activation and phosphorylation at Y561 in MIN6 cells. (A) LMP-EV and LMP-shNck1 MIN6 cell lysates (50 μg of protein) from six independent culture dishes were subjected to immunoblotting with indicated antibodies. Bar charts show the ratio of pThr-980 PERK to total PERK and peIF2αS51 to total eIF2α determined by densitometry. Data are mean ± SEM (n = 3; *P < 0.001, **P = 0.002, Mann–Whitney). (B) LMP-EV and LMP-shNck1 MIN6 cells were pretreated with 100 μM PV for 20 min and then washed with PBS and further treated with 1 μM Tg for 0, 7, and 15 min. Cell lysates (50 μg of protein) were subjected to immunoblotting with indicated antibodies (n = 3).