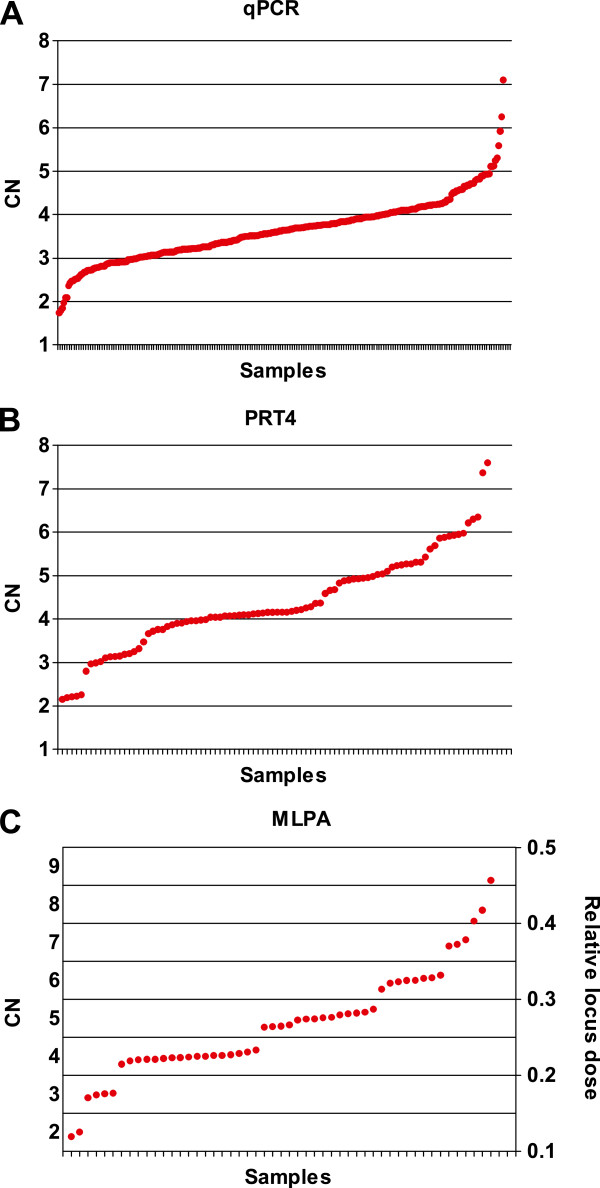
Figure 1.
Scatter plots of raw data of the three methods. Raw data were plotted in ascending order. (A) qPCR - raw CNs of all samples were included. (B) PRT4 - raw CNs of samples in a typical 96-well plate were included. (C) MLPA - the relative locus dose (right axis) of samples in a typical batch were included.

