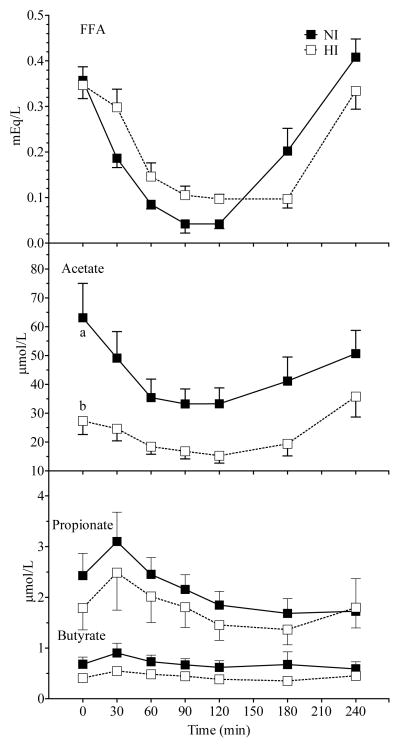
Figure 2.
Mean (± SEM) FFA, serum acetate, propionate and butyrate concentrations after Glucose and Inulin in NI and HI subjects. A significant main effect of group was observed for acetate (p = 0.01). A significant group × time interaction was observed for FFA (p = 0.001). Within a time point, labelled means without a common letter differ (a vs b, p <0.01; Bonferroni post-test after demonstration of significant main effect of group by ANOVA).

