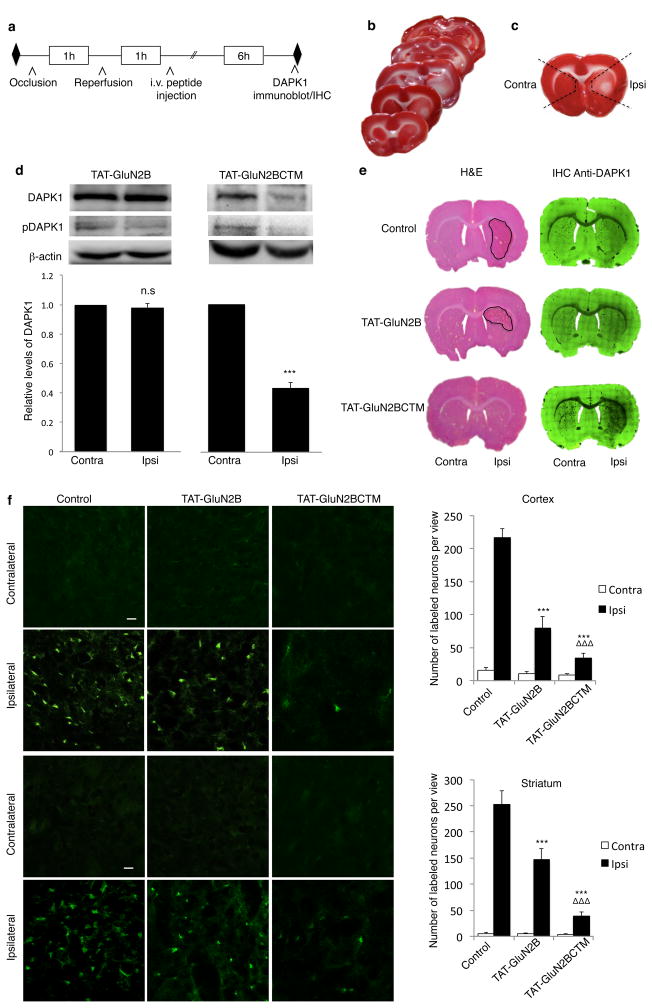
Figure 6. TAT-GluN2BCTM specifically knocks down DAPK1 in ischemic brain areas and reduces neuronal damage in the MCAo model of focal ischemia in rats.
(a) Timeline of tissue collection for analysis of DAPK1 degradation in rats. (b) 2,3,5-triphenyltetrazolium chloride (TTC) staining of a series of transverse brain sections showed reliable damage in the ipsilateral side following unilateral MCAo. (c) Black-dashed lines represent brain areas removed for immunoblotting. (d) Immunoblots demonstrate specific DAPK1 knockdown in the infract (Ipsi), but not contralateral (Contra) side following application of TAT-GluN2BCTM (10mg/kg, i.v.; n=3; t(4)=14.459, p<0.001), but not TAT-GluN2B (10mg/kg, i.v.; n=3; t(4)=0.739, p=0.501). β-actin was used as a loading control, two-tailed student’s t-test ***p<0.001 (e) Images of Hematoxylin & Eosin (left) and immunohistochemical DAPK1 staining (right) of adjacent brain sections show that compared with saline (top) and TAT-GluN2B treated (middle) controls, TAT-GluN2BCTM treatment (bottom) selectively reduced infarct area (left) and DAPK1 levels (right) ipsilaterally. (f) Left, images of brain sections stained with Fluorojade B in rats injected with saline (n=6), TAT-GluN2B (n=5) or TAT-GluN2BCTM (n=5) after treatment as shown in a, scale bar 20μm. Right, quantification of cellular damage by counting the number of Fluorojade B-positive cells in each image at 10X magnification. TAT-GluN2BCTM (10mg/kg) displayed more prominent neuroprotection in the cortex (top p<0.001) and striatum (bottom p<0.001) as compared to TAT-GluN2B (10mg/kg). Cortex: H(2)=41.235; p<0.001; striatum: H(2)=38.808; p<0.001. Kruskal-Wallis ANOVA on ranks with Dunn’s post-hoc, bars represent relative mean values±s.e.m, ***,ΔΔΔp<0.001. n represents tissue from 3 animals collected from at least 2 litters. Full-length blots are presented in Supplementary Figure 9.

