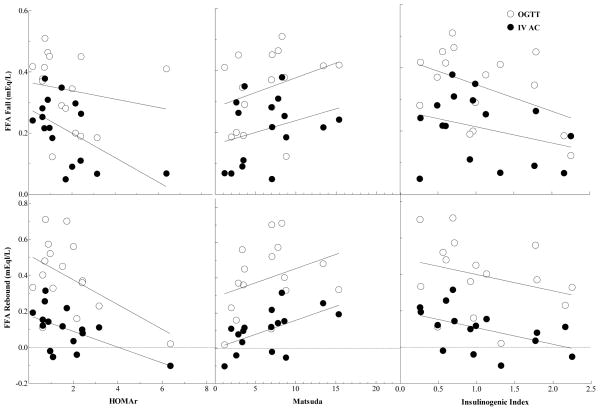
Figure 4.
Relationships between HOMA-IR, Matsuda and Insulinogenic Index vs FFA fall and rebound after oral glucose tolerance test (OGTT) and intravenous acetate infusion (IV AC) in NI and HI participants. Correlation coefficients for HOMA-IR vs FFA fall: Glucose, NS; Acetate, r = −0.565 (P = 0.02). HOMA-IR vs FFA rebound: Glucose, r = −0.515 (P = 0.04); Acetate, r = −0.564 (P = 0.02). Matsuda Index vs FFA fall: Glucose, NS; Acetate, NS. Matsuda Index vs FFA rebound: Glucose, NS; Acetate, r = 0.557 (P = 0.03). Insulinogenic Index vs FFA fall: Glucose, NS; Acetate, NS. Insulinogenic Index vs FFA rebound: Glucose, NS; Acetate, r = −0.500 (P = 0.05).

