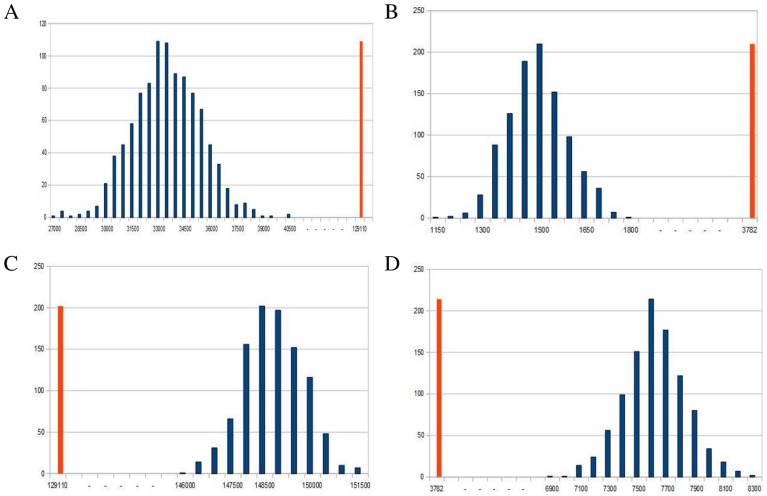
Figure 2. A. Randomization of miRNA-target links.
Distribution of the number of FFLs for 1000 simulations obtained with JASPAR TFs list and confirmed by at least 4 miRNA databases (Z = 49,4). B. Randomization of miRNA-target links. Distribution of the number of FFLs for 1000 simulations obtained with ENCODE TFs list and confirmed by at least 4 miRNA databases (Z = 23,3). C. Randomization of TF-target links. Distribution of the number of FFLs for 1000 simulations obtained with JASPAR TFs list and confirmed by at least 4 miRNA databases (Z = −20,8). D. Randomization of TF-target links. Distribution of the number of FFLs for 1000 simulations obtained with ENCODE TFs list and confirmed by at least 4 miRNA databases (Z = −18,1).

