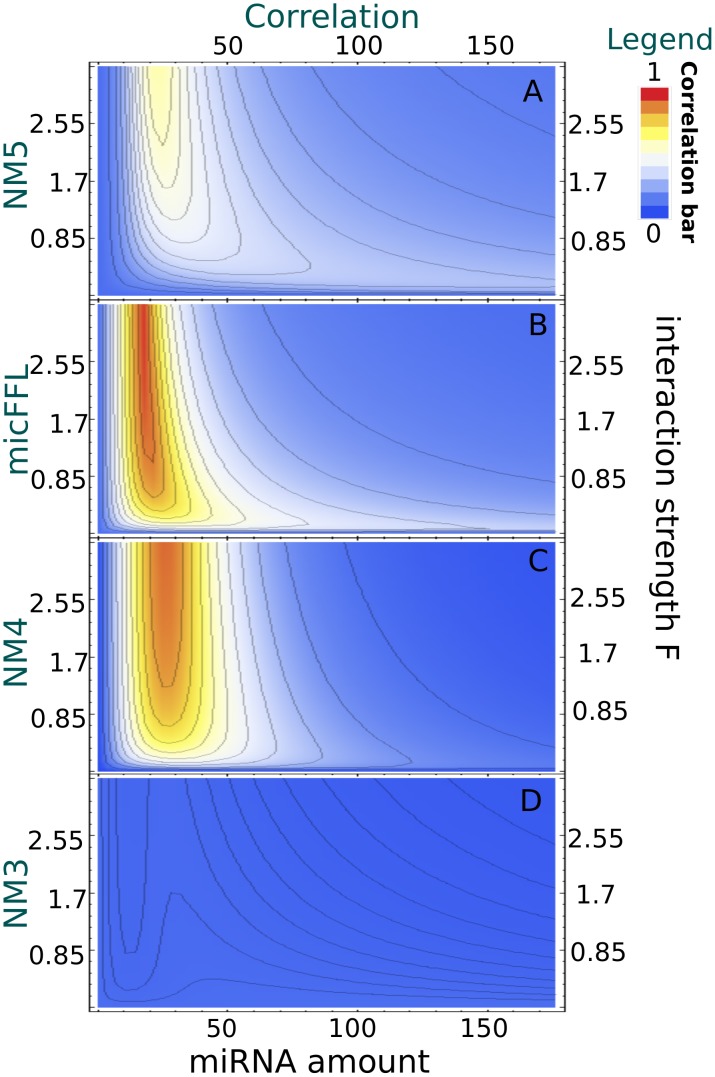
Figure 4. Heat map of the correlation  for the micFFL and NM3,NM4 and NM5 Null Models.
In each plot the values of  is mapped as a function of the miRNA concentration and of the interaction strength
  . While for NM3 and NM5 the fluctuation of TF and T are almost uncorrelated, both NM4 and the micFFL show a well defined region of large correlation. This correlation occurs for rather low miRNA concentrations and for almost any value of the miRNA-mRNA interaction strength.

