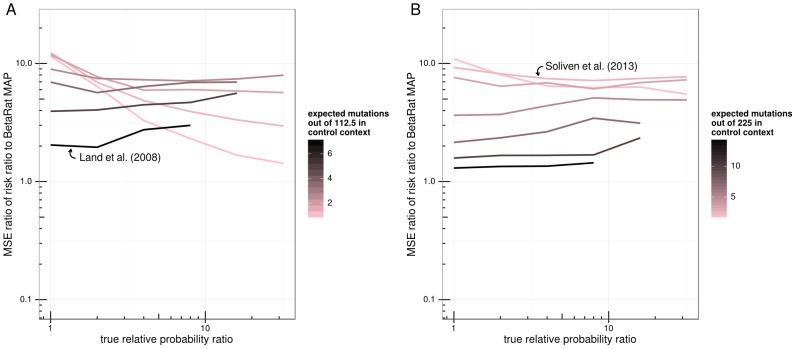
Figure 2. Comparison of MAP to mid-P and RR effect size estimates based on mutation count simulations of 600 bp (A) and 1200 bp (B) length sequences.
The ratio of the mean squared error (MSE) of the RR estimate to that of the MAP estimator is plotted for each simulation parameter set. Points are grouped into lines and colored by control context mutation probability. The x-axis shows the relative probability ratio used for simulation. MSE ratio values greater than one indicate parameter regimes where MAP estimator does better than the RR or the mid-P estimator. Note that because RR isn't necessarily well-defined when one of the counts is zero, pseudocounts were added (see Materials and Methods). Arrows label simulations in the parameter regime of the indicated study.

