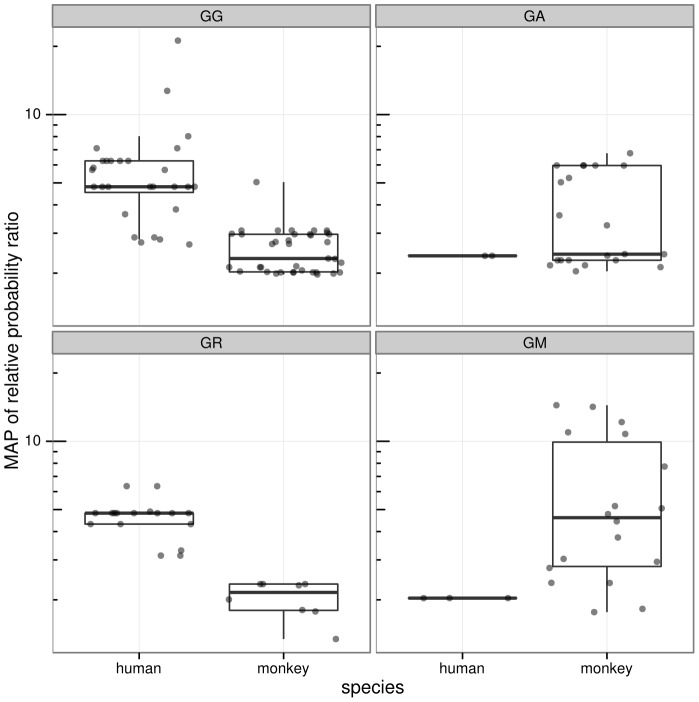
Figure 4. Viral sequences show distinct hypermutation profiles in the two host species, congruent with activity observed in other studies.
Box and whisker plots on the same data are overlaid, where the thick horizontal bar shows the median value of the observations and the rectangle spans the first and third quartiles; points are randomly “jittered” horizontally within a species to avoid superimposed points. Panels labeled by target context using IUPAC degenerate notation, thus “R” designates A or G, and “M” designates A or C.

