
Figure 3.
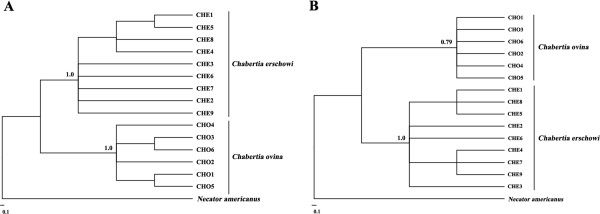
Inferred genetic relationships of 15 individual Chabertia specimens. The analyses were carried out by Bayesian inference (BI) based on mitochondrial rrnS (A) and nad2 (B) sequence data, using Necator americanus as the outgroup.
Official websites use .gov
A
.gov website belongs to an official
government organization in the United States.
Secure .gov websites use HTTPS
A lock (
) or https:// means you've safely
connected to the .gov website. Share sensitive
information only on official, secure websites.
Inferred genetic relationships of 15 individual Chabertia specimens. The analyses were carried out by Bayesian inference (BI) based on mitochondrial rrnS (A) and nad2 (B) sequence data, using Necator americanus as the outgroup.