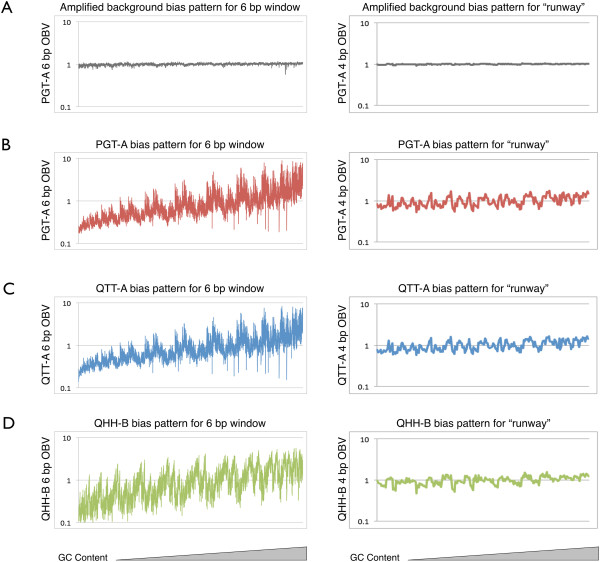
Figure 4.
Bias profiles for the SL and amplification experiments. All bias profiles were created by plotting the observed bias value (OBV) for the 4 bp (n = 256) and 6 bp (n = 4,096) windows of observation on a logarithmic scale versus the amplified sequences, which were arranged from low to high GC content in the order of ATCG; (A) the bias observed after amplification with primer set I; (B) after amplification using primer set II with PGT-A DNA polymerase; (C) using primer set II with QTT-A DNA polymerase; (D) using primer set II with QHH-B DNA polymerase.

