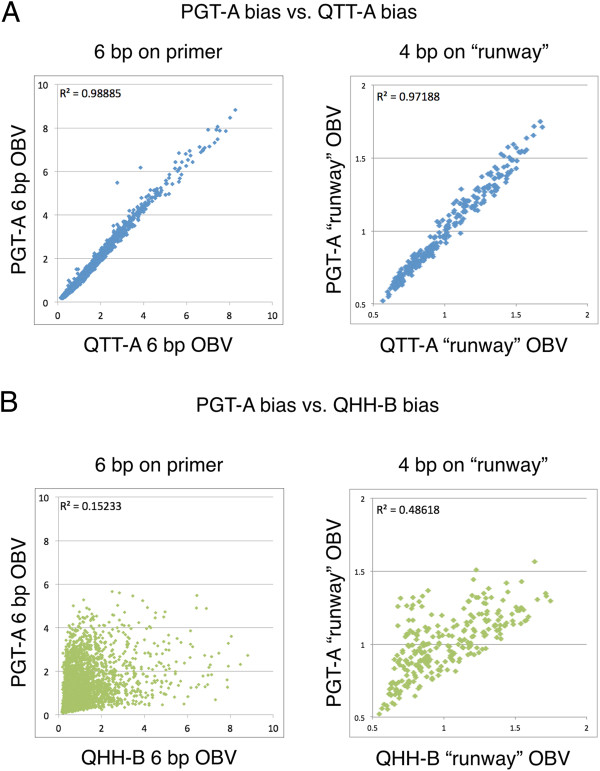
Figure 5.
Correlation of amplified libraries. (A) A plot of the OBV of two family A polymerases (PGT-A versus QTT-A) demonstrates a high degree of correlation throughout the primer:template (6 bp) and runway (4 bp) regions; (B) a plot of the OBV of PGT-A versus OBV of QHH-B indicates that resulting amplification profile is weakly correlated for both the primer:template interaction (6 bp) and the runway (4 bp) for two differing families of polymerases.

