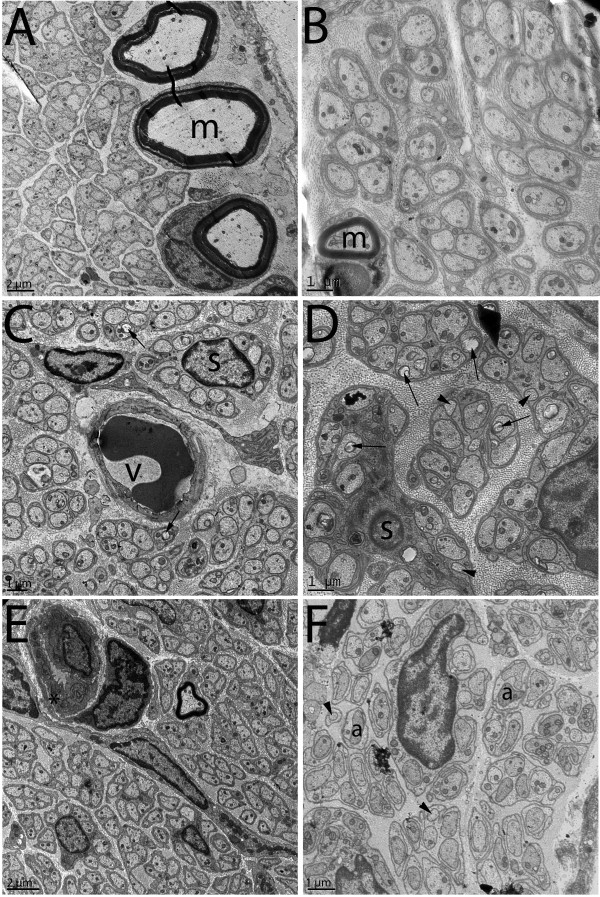
Figure 2.
Transmission electron microscopy cross sections of renal nerves from acute control (A), chronic control (B), acute diabetic (C), chronic diabetic (D), acute diabetic treated with insulin (E) and chronic diabetic treated with insulin (F) animals. No ultrastructural alterations were evident on the controls that show typical Schwann cell units. Myelinated fibers are indicated by “m”. Acute diabetic nerves showed mild destruction of axonal mitochondria (arrows) and unmyelinated fiber enlargement with signs of swelling and degeneration (*). Chronic diabetic nerves presented with severe destruction of axonal mitochondria (arrows), micro-axons formation (arrowheads) and thickening of the endoneural space with an increased density of collagen fibers. Insulin treated animals showed alterations of the endoneural blood vessels such as thickening of the basement membrane (*) and lumen reduction at early stages (E). In chronic stages, very small unmyelinated axons were present (arrowheads), edema of the endoneural space could be evidenced and unmyelinated fibers with atrophy (a) were frequent. Bar = 1 μm for B, C, D and F. Bar = 2 μm for A and E.

