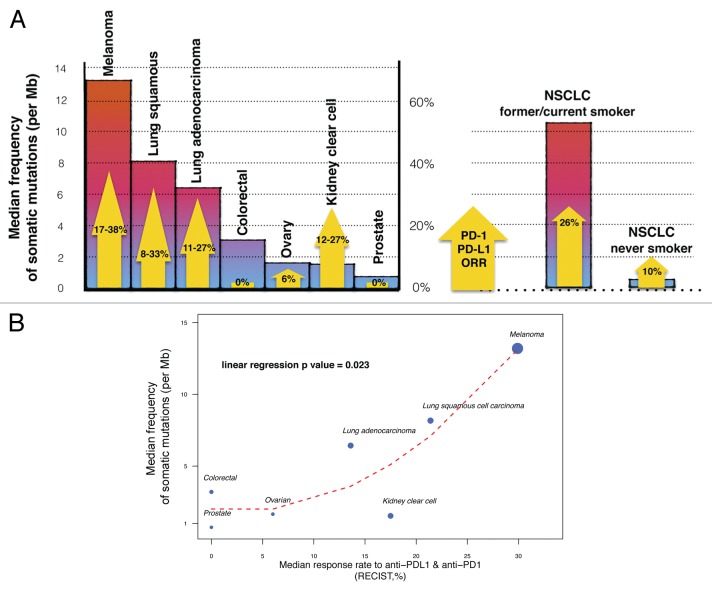
Figure 1. Link between mutational heterogeneity and response to immune checkpoint blockers. (A) Mutational heterogeneity of tumors and overall response rates (ORRs) to PD-1/PD-L1-targeting agents. Colored bars indicate the median frequency of somatic mutations per megabase (Mb) reported for patients affected by different solid tumors. Yellow arrows represent the ORRs of these patients to anti-PD-1/PD-L1 antibodies, as detailed in Table 1. NSCLC, non-small cell lung carcinoma. (B) Correlation between median frequency of somatic mutations and ORR to PD-1/PD-L1-targeting agents in solid tumors. Dot size is proportional to the number of patients in which the efficacy of anti-PD-1/PD-L1 antibodies was tested. The red dashed line represents the LOESS regression curve. The P value is derived from a linear univariate model (median somatic mutation frequency ~ORR to anti-PD-1/PD-L1 agents).

An official website of the United States government
Here's how you know
Official websites use .gov
A
.gov website belongs to an official
government organization in the United States.
Secure .gov websites use HTTPS
A lock (
) or https:// means you've safely
connected to the .gov website. Share sensitive
information only on official, secure websites.
