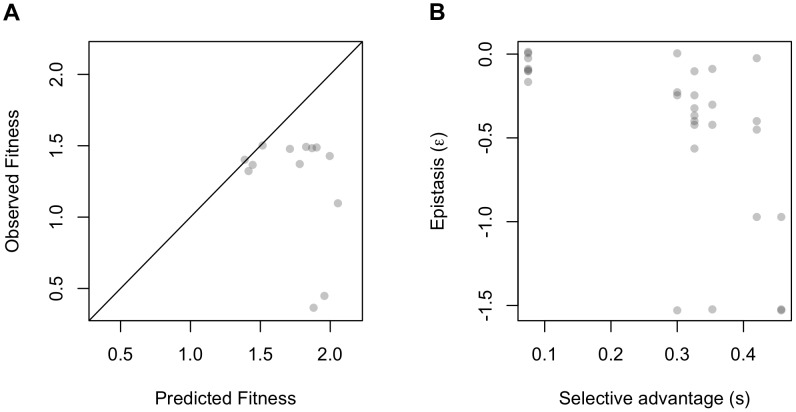
Figure 2. Epistasis at the level of expression phenotypes and fitness relative to independence or kinetic model.
A) Fitness values of mutation combinations are consistently lower than expected by multiplicative independence. B) Mutations with larger with selective advantages (s) when tested alone in the ancestor have more negative ε values in combination with other mutations.

