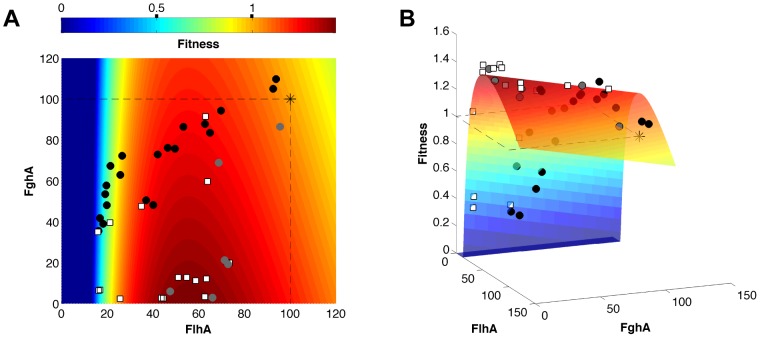
Figure 4. Fitness landscape of the GSH-linked pathway.
A) A two-dimensional heatmap and B) three-dimensional surface showing the shape of the fitness landscape predicted by the model. The x and y axes are FlhA and FghA levels relative to ancestor (set at 100). Though the plasmid cost is included in the model, this fourth dimension was corrected for to allow a three-dimensional visualization (see Methods). Experimental data points indicate the ancestor (asterisk), single mutants (grey circles), mutational combinations (white squares), and inducible expression vectors (black circles).

