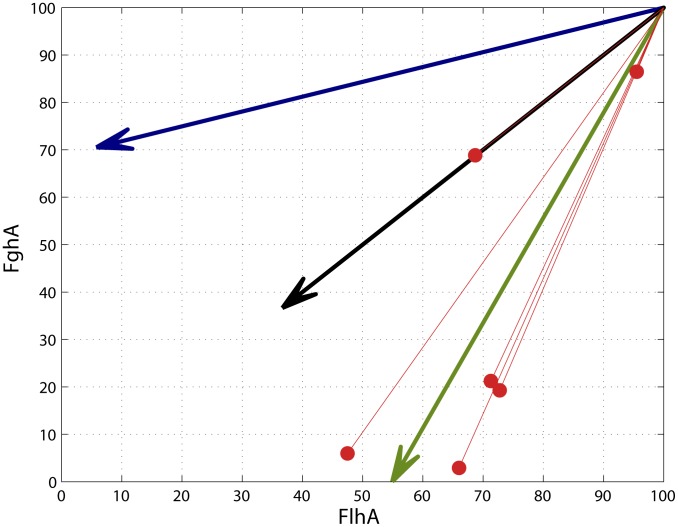
Figure 5. Adaptive mutations tended to move phenotypes toward the global optimum.
The direction of phenotypic movements for strains with single mutations (red lines; enzyme levels of ancestor set to 100) are compared to the vectors indicating of the locally steepest fitness gradient for the ancestor (blue), complete 1∶1 correlation between phenotypes (black), and the global optimum (green). The direction of phenotypic movement for all single mutations was closer to the vector for the global optimum relative to the local gradient around the ancestor.

