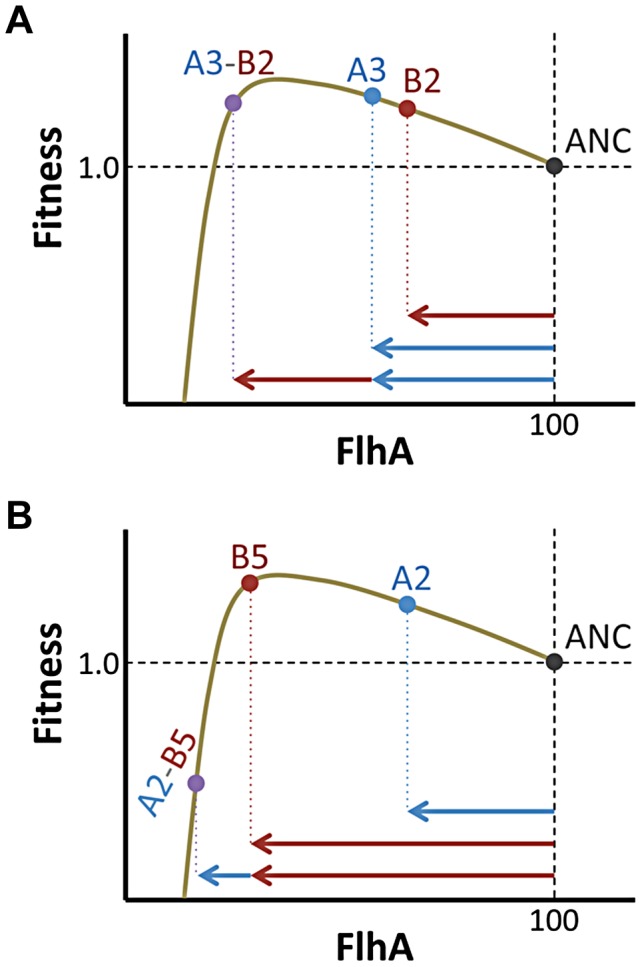
Figure 6. Phenotype and not just fitness value determines epistatic interactions.

Mutations (A) A3 and (B) B5 had similar fitness values, but resided on opposite flanks of the optimal phenotype (shown here for simplicity as FlhA enzyme levels). In interactions with secondary beneficial mutations (B2 and A2, respectively), B5 fares worse due to being closer to the fitness cliff that occurs when FlhA catalysis becomes limiting.
