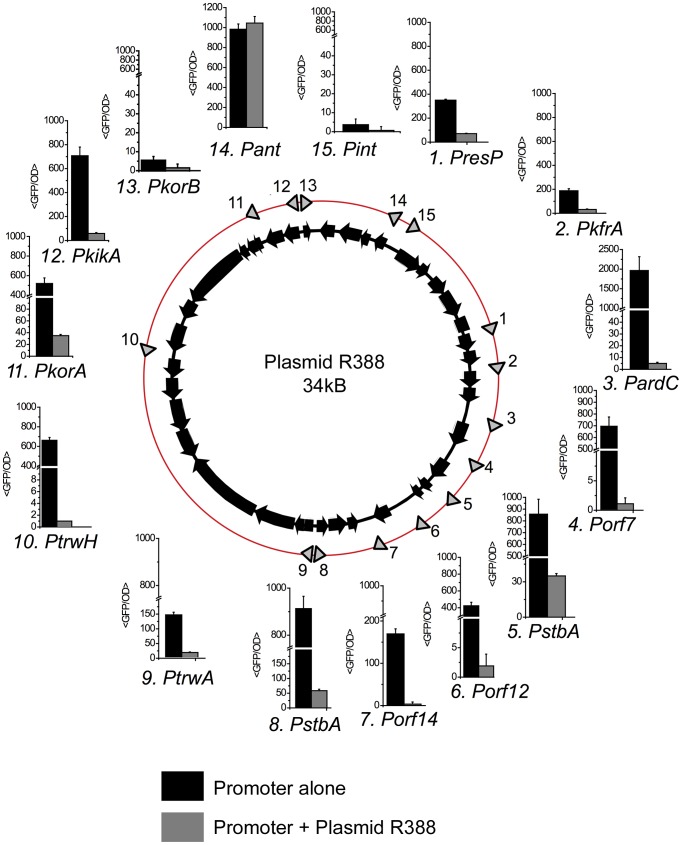
Figure 1. Promoters in plasmid R388.
The figure shows the location and transcriptional activity of promoters detected in plasmid R388 genome. The location of each promoter is indicated by an arrow on the red circle. Each promoter receives the name of the first gene encoded in the transcriptional unit. Bar charts indicate the expression levels when the promoter activity was measured alone (black columns) or in cells that also contained plasmid R388 (grey columns). The expression levels (<GFP/OD>) represent the average GFP/OD (×102) level achieved by cells growing in exponential phase. Each column represents the average and standard deviation of at least five independent experiments.

