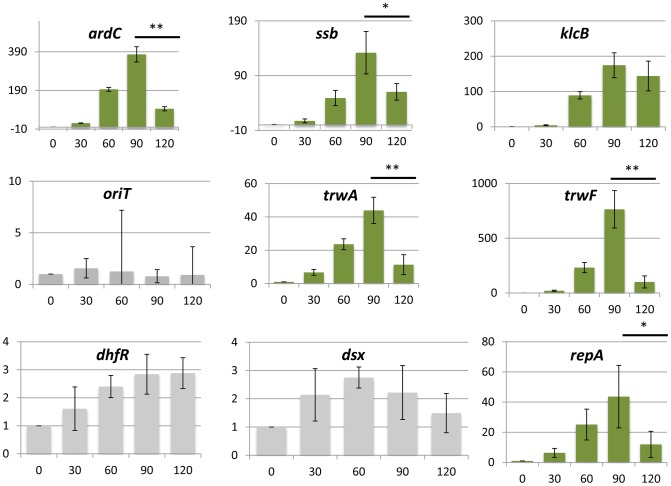
Figure 5. Promoter induction after horizontal transfer of the plasmid.
RT-qPCR was used to measure mRNA levels. Bars indicate the relative ratio of mRNA at each time point compared to the values obtained in the absence of conjugation (time 0). Asterisks indicate the statistical significance of the differences observed * = p<0.1, ** = p<0.05 Experimental procedures and calculations are detailed in Materials and Methods and expanded results are shown in Supporting Figure S4. Measurements represent the average of three independent mRNA extractions.

