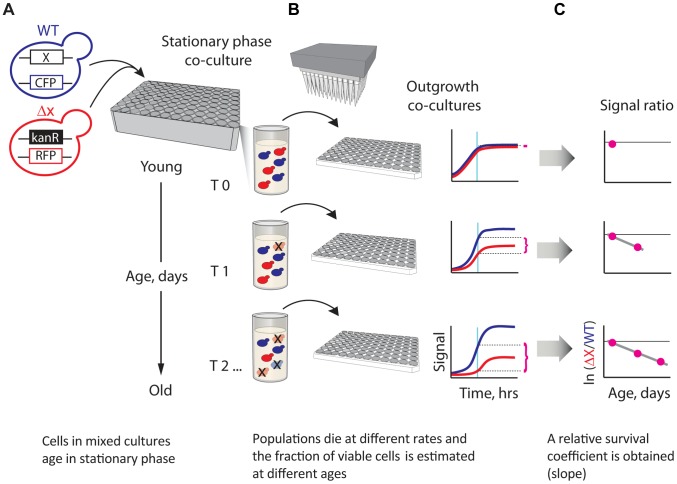
Figure 1. A novel strategy enabling quantitative genetic analysis of yeast CLS.
(A) Schematic showing an RFP-labeled mutant, xΔ, that lives shorter than the CFP-labeled WT reference. Strains are mixed in equal amounts and grown to saturation in 96-deep-well plates, where the mixed population ages. (B) At regular time intervals, outgrowth cultures are automatically inoculated from the same aging stationary-phase plate onto fresh medium and monitored for growth. The relative initial fraction of viable cells (magenta braces) is approximated from the change in relative fluorescence signal interpolated to a fixed time point (cyan vertical line) in exponential outgrowth. (C) The change in ratio of viable cells as a function of age is used to obtain an apparent relative survival coefficient, s, which is a direct estimate of the lifespan of xΔ relative to WT.

