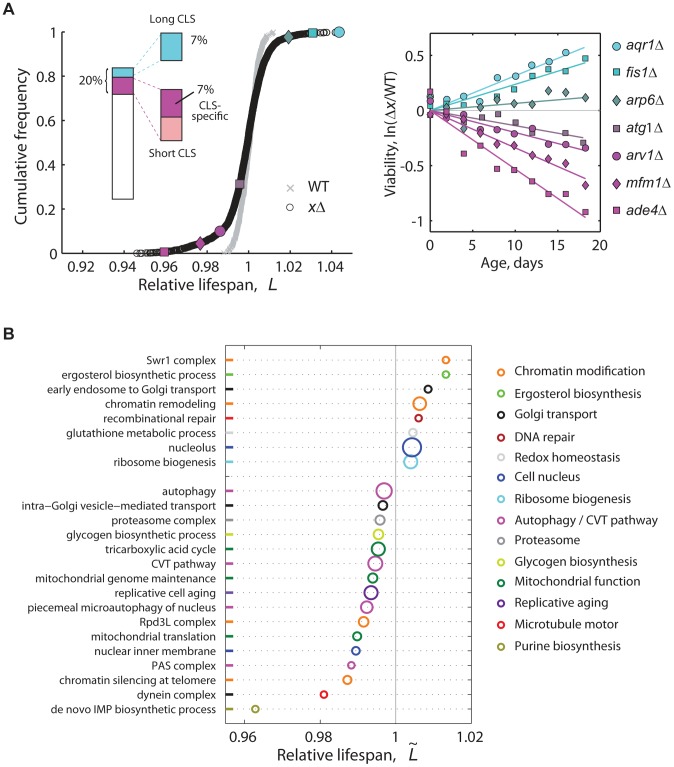
Figure 2. High-resolution genome-wide screening of yeast CLS.
(A) Cumulative frequencies of the relative lifespan of most viable knockout strains (black circles, n = 3,878) and replicates of the WT (gray crosses, n = 414). Colored symbols correspond to selected knockouts (right panel). Inset shows the fraction of significant short- (magenta) and long-lived phenotypes (cyan) (5% FDR). Short-CLS phenotypes with reduced growth capacity (G<0.95) were filtered-out from subsequent analyses (see Figure S5). (B) CLS-specific gene groups and pathways; plot shows the median relative lifespan ( ) of genes annotated in the same GO term, which was compared in each case to the median lifespan of the entire data set. Labels at the vertical axis show representative enriched GO categories (p<0.05, Wilcoxon rank sum test). The radius of each circle indicates the number of measured gene knockouts within the GO group, the minimum being five (de novo IMP biosynthesis) and the maximum 39 (nucleolus); colors were arbitrarily assigned to similar functional categories. Data set includes 3,286 strains that have no marked defect in growth (G>0.95).

