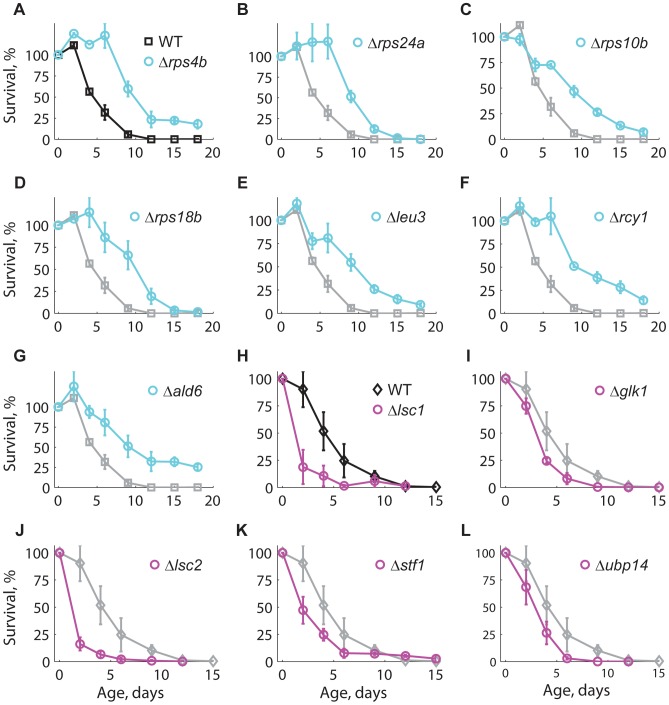
Figure 3. Longevity phenotypes were confirmed using the standard CLS method.
Survival curves under non-buffered SC medium for WT (black), (A–G) long-lived (cyan), and (H–L) short-lived knockout strains (magenta). Only those strains that were different from the WT are shown; for comparison, the CLS of the WT is shown in each panel (gray). Each strain was assayed in three independent experiments; data points are the average and error bars indicate the SEM. One-hundred percent survival corresponds to the colony-forming units measured at day four after inoculation (age zero).

