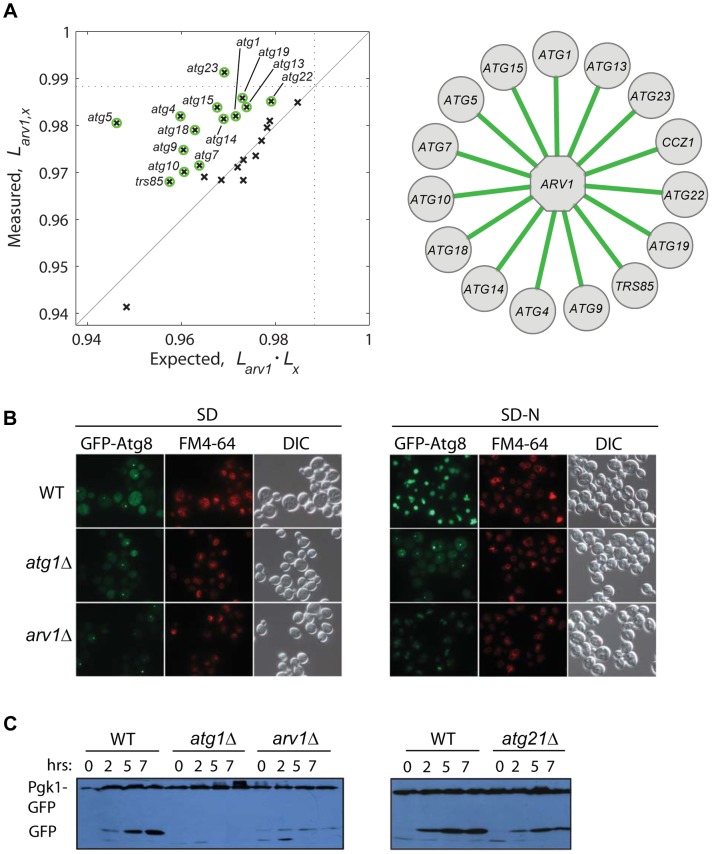
Figure 5. Functional link between autophagy and Arv1 underlies CLS.
(A) Genetic interaction analysis of ARV1. The relative lifespan of 26 arv1Δ, xΔ double knockouts is plotted against the expected multiplicative combination of the corresponding pairs of single knockouts. Dotted lines at the horizontal and vertical axes show the effect of the arv1Δ single knockout. Green circles indicate significant deviations from the neutral expectation (>95% CI), which are shown as green edges connecting ARV1 to the interacting gene (right). (B) Micrographs of WT and gene-knockout strains expressing the GFP-Atg8 fusion protein under basal conditions (SD, left) and after 7 h of nitrogen starvation (SD-N, right). Vacuoles were stained with FM4-64; DIC images show the position of yeast cells. (C) Western blot analysis of nitrogen-starved strains expressing the fusion protein Pgk1-GFP: WT and cells depleted for Arv1, the core-autophagy Atg1 protein, or the accessory Atg21 protein. Time zero corresponds to mid-log cultures before transfer to SD-N medium where cells grew for 2, 5, or 7 h before lysis.

