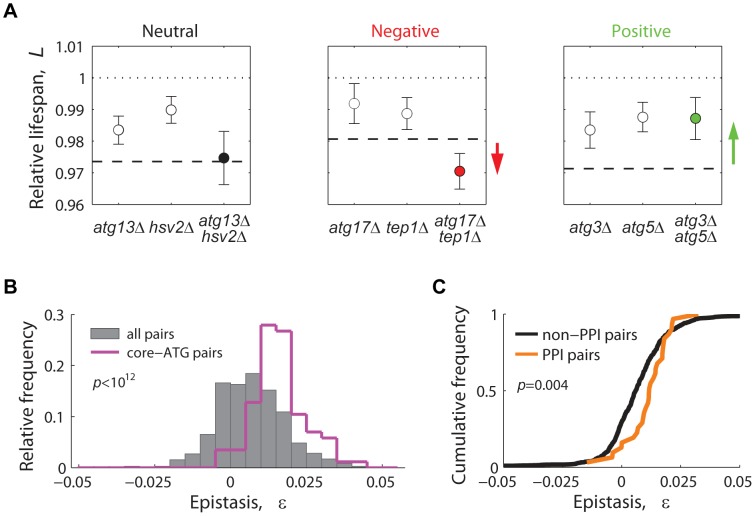
Figure 6. Lifespan-epistatic interactions recapitulate functional and physical associations.
(A) Plots show the measured relative lifespan of representative gene pairs (single and double knockouts) with neutral (left panel), negative (center panel), and positive epistasis (right panel). Dashed lines indicate the multiplicative expectation in each case, that is, Lx Δ · Ly Δ. Error bars indicate the 95% CI. (B) Spectrum of epistasis measured for all gene pairs (gray histograms, n = 721) and for core-autophagy gene pairs (purple histogram outline, n = 75); (C) Comparative cumulative distributions of ε for gene pairs coding for proteins that interact (orange line, n = 31) or do not interact physically (black line, n = 690); the p-value is from the Wilcoxon rank-sum test.

