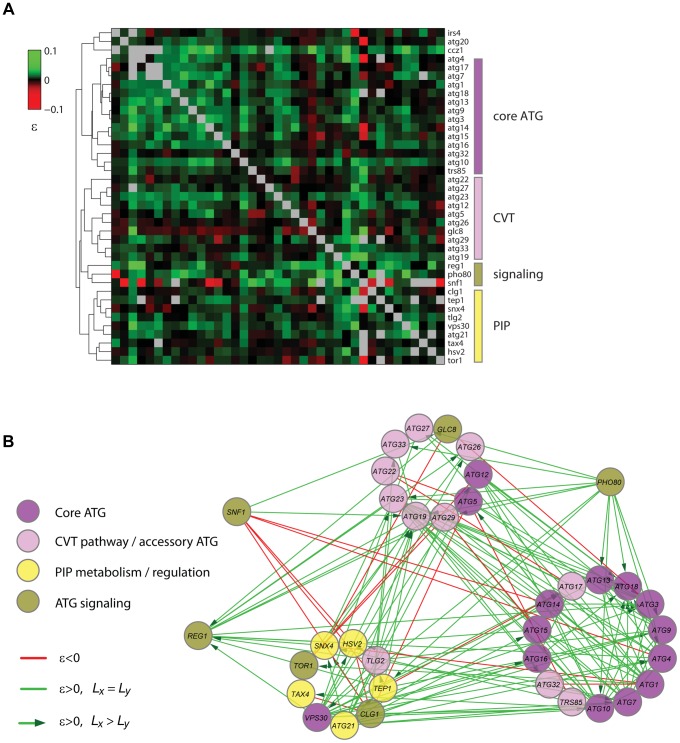
Figure 7. Quantitative lifespan-epistasis analysis reveals functional associations within and between pathways underlying CLS.
(A) Hierarchical-cluster analysis of lifespan-epistasis data. Each column/row represents the interaction pattern for a specific gene; the color scale indicates the epistasis interaction strength, ε. Dendrogram clusters are highlighted in colored bars (right). (B) Network representation of gene clusters and their interactions. Node color depicts the gene's known biological function. Edges show significant negative (red) or positive (green) epistasis (95% CI). Arrows indicate cases of significant CLS-differences between the two single knockouts, with directionality from the largest to the smallest single knockout effect.

