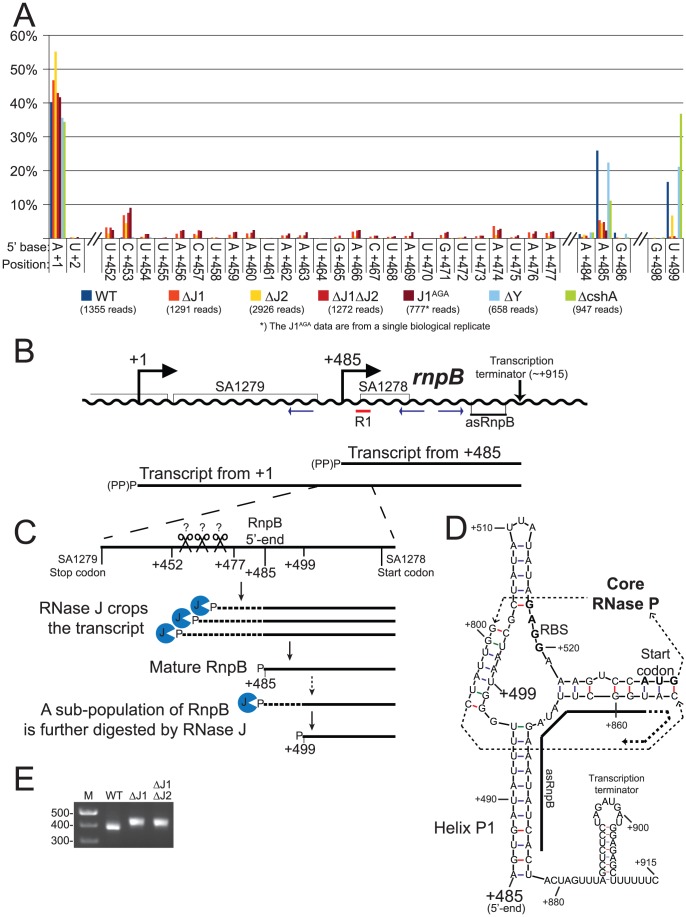
Figure 5. Both maturation and inactivation of RNase P RNA is carried out by RNase J.
A) Histogram showing the percentage of reads mapping to a given position, out of the total number of reads mapping to the putative SA1279-rnpB operon in each strain (shown in parentheses). Only positions of interest are included, but the full data-set can be found in Table S6. +1: The putative transcription start site of SA1279. +452 to +477: The RNase J mutants accumulate RNA with 5′-ends in this region. +485: The putative transcription start site of rnpB, a major detected RNA species in the WT, ΔY and ΔcshA, but very reduced in the RNase J mutants. +499: A major detected RNA species in the WT, ΔY and ΔcshA, however it is absent from the RNase J1 mutants and reduced in the ΔJ2 strain. B) The layout of the region around SA1279 and rnpB. DNA is represented as a wavy line, and RNA transcripts as straight black lines. (PP)P indicates a mix of tri- and mono-phosphorylated RNA, generated by pyrophosphohydrolases. Small blue arrows indicate the PCR-primers used to amplify circularised RnpB and SA1279-RnpB for mapping the 5′ and 3′-ends. R1 indicates the probe used for the Northern blot shown in Figure S2. C) A blow-up of the region from +420 to +540, showing the proposed model for converting the +1 transcript into mature RnpB. P indicates mono-phosphorylation. D) Predicted secondary structures of RnpB, generated using mfold with default settings [30], and based on the crystal structures of RNase P RNA [27], [31]. Within the RNase P structure, the thin dotted arrows indicate the path of the RNA through the secondary and tertiary structure of RNase P, the RBS and start codon of SA1278 are in bold, and the region where the anti-sense RNA can hybridise is indicated with a thick black line. E) The difference in average length of RnpB in WT, ΔJ1, and ΔJ1ΔJ2 strains, revealed by the length of the PCR-product generated across the 5′/3′ junction. Results of the cloned and sequenced PCR-products are shown in Table 6. M: Marker.

